The Hartford 2007 Annual Report Download - page 150
Download and view the complete annual report
Please find page 150 of the 2007 The Hartford annual report below. You can navigate through the pages in the report by either clicking on the pages listed below, or by using the keyword search tool below to find specific information within the annual report.-
 1
1 -
2
-
3
-
4
-
5
-
6
-
7
-
8
-
9
-
10
-
11
-
12
-
13
-
14
-
15
-
16
-
17
-
18
-
19
-
20
-
21
-
22
-
23
-
24
-
25
-
26
-
27
-
28
-
29
-
30
-
31
-
32
-
33
-
34
-
35
-
36
-
37
-
38
-
39
-
40
-
41
-
42
-
43
-
44
-
45
-
46
-
47
-
48
-
49
-
50
-
51
-
52
-
53
-
54
-
55
-
56
-
57
-
58
-
59
-
60
-
61
-
62
-
63
-
64
-
65
-
66
-
67
-
68
-
69
-
70
-
71
-
72
-
73
-
74
-
75
-
76
-
77
-
78
-
79
-
80
-
81
-
82
-
83
-
84
-
85
-
86
-
87
-
88
-
89
-
90
-
91
-
92
-
93
-
94
-
95
-
96
-
97
-
98
-
99
-
100
-
101
-
102
-
103
-
104
-
105
-
106
-
107
-
108
-
109
-
110
-
111
-
112
-
113
-
114
-
115
-
116
-
117
-
118
-
119
-
120
-
121
-
122
-
123
-
124
-
125
-
126
-
127
-
128
-
129
-
130
-
131
-
132
-
133
-
134
-
135
-
136
-
137
-
138
-
139
-
 140
140 -
 141
141 -
 142
142 -
 143
143 -
 144
144 -
 145
145 -
 146
146 -
 147
147 -
 148
148 -
 149
149 -
 150
150 -
 151
151 -
 152
152 -
 153
153 -
 154
154 -
 155
155 -
 156
156 -
 157
157 -
 158
158 -
 159
159 -
 160
160 -
161
-
162
-
163
-
164
-
165
-
166
-
167
-
168
-
169
-
170
-
171
-
172
-
173
-
174
-
175
-
176
-
177
-
178
-
179
-
180
-
181
-
182
-
183
-
184
-
185
-
186
-
187
-
188
-
189
-
190
-
191
-
192
-
193
-
194
-
195
-
196
-
197
-
198
-
199
-
200
-
201
-
202
-
203
-
204
-
205
-
206
-
207
-
208
-
209
-
210
-
211
-
212
-
213
-
214
-
215
-
216
-
217
-
218
-
219
-
220
-
221
-
222
-
223
-
224
-
225
-
226
-
227
-
228
-
229
-
230
-
231
-
232
-
233
-
234
-
235
-
236
-
237
-
238
-
239
-
240
-
241
-
242
-
243
-
244
-
245
-
246
-
247
-
248
-
249
-
250
-
251
-
252
-
253
-
254
-
255
-
256
-
257
-
258
-
259
-
260
-
261
-
262
-
263
-
264
-
265
-
266
-
267
-
268
-
269
-
270
-
271
-
272
-
273
-
274
-
275
-
276
 |
 |
150
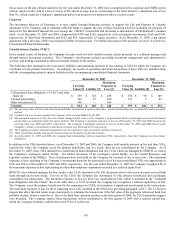
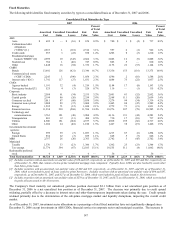
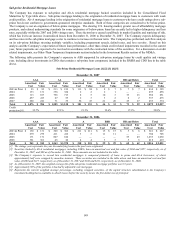
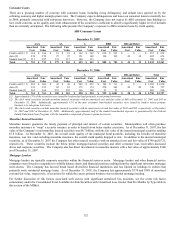
Commercial Mortgage Loans
Commercial real estate market cash flow fundamentals have been solid with mortgage delinquencies near all time lows. Recently,
however, commercial real estate rents and property values have begun to soften. The following tables represent the Company’ s
exposure to CMBS bonds and commercial real estate CDOs by credit quality and vintage year.
CMBS – Bonds [1]
December 31, 2007
AAA AA A BBB
BB and Below Total
Amortized
Cost
Fair
Value
Amortized
Cost
Fair
Value
Amortized
Cost
Fair
Value
Amortized
Cost
Fair
Value
Amortized
Cost
Fair
Value
Amortized
Cost
Fair
Value
2003 & Prior $ 2,666 $ 2,702 $ 495 $ 502 $ 289 $ 292 $ 30 $ 32 $ 46 $ 49 $ 3,526 $ 3,577
2004 709 708 89 87 130 128 23 21 — — 951 944
2005 1,280 1,258 479 454 404 389 85 76 24 21 2,272 2,198
2006 2,975 2,910 415 395 763 739 456 400 24 22 4,633 4,466
2007 1,365 1,342 461 431 240 220 190 165 3 3 2,259 2,161
Total $ 8,995 $ 8,920 $ 1,939 $ 1,869 $ 1,826 $ 1,768 $ 784 $ 694 $ 97 $ 95 $ 13,641 $ 13,346
Credit
protection 23.8% 16.4% 13.6% 6.8% 3.7% 20.6%
December 31, 2006
AAA AA A BBB
BB and Below Total
Amortized
Cost
Fair
Value
Amortized
Cost
Fair
Value
Amortized
Cost
Fair
Value
Amortized
Cost
Fair
Value
Amortized
Cost
Fair
Value
Amortized
Cost
Fair
Value
2003 & Prior $ 3,435 $ 3,463 $ 617 $ 623 $ 525 $ 529 $ 91 $ 96 $ 53 $ 65 $ 4,721 $ 4,776
2004 882 867 103 100 129 127 27 27 — — 1,141 1,121
2005 1,473 1,457 694 687 555 551 237 237 5 5 2,964 2,937
2006 2,471 2,489 462 465 1,046 1,055 496 497 35 35 4,510 4,541
Total $ 8,261 $ 8,276 $ 1,876 $ 1,875 $ 2,255 $ 2,262 $ 851 $ 857 $ 93 $ 105 $ 13,336 $ 13,375
[1] The vintage year represents the year the pool of loans was originated.
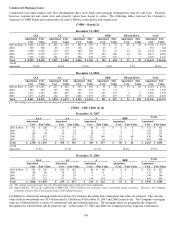
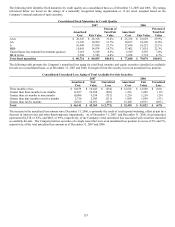
CMBS – CRE CDOs [1] [2]
December 31, 2007
AAA AA
A BBB
Total
Amortized
Cost Fair Value
Amortized
Cost Fair Value
Amortized
Cost Fair Value
Amortized
Cost Fair Value
Amortized
Cost Fair Value
2003 & Prior $ 361 $ 288 $ 119 $ 95 $ 44 $ 36 $ 8 $ 6 $ 532 $ 425
2004 97 77 32 25 12 9 2 2 143 113
2005 120 99 30 24 10 8 2 1 162 132
2006 521 472 136 112 222 160 51 40 930 784
2007 251 219 121 100 81 64 23 17 476 400
Total $ 1,350 $ 1,155 $ 438 $ 356 $ 369 $ 277 $ 86 $ 66 $ 2,243 $ 1,854
Credit
protection
31.5%
27.1%
16.7%
10.4%
27.5%
December 31, 2006
AAA AA
A BBB
Total
Amortized
Cost Fair Value
Amortized
Cost Fair Value
Amortized
Cost Fair Value
Amortized
Cost Fair Value
Amortized
Cost Fair Value
2003 & Prior $ 324 $ 320 $ 106 $ 105 $ 40 $ 40 $ 6 $ 6 $ 476 $ 471
2004 86 86 28 28 11 11 2 2 127 127
2005 111 111 28 28 9 9 1 1 149 149
2006 539 537 97 96 154 154 54 54 844 841
Total $ 1,060 $ 1,054 $ 259 $ 257 $ 214 $ 214 $ 63 $ 63 $ 1,596 $ 1,588
[1] The vintage year represents the year the underlying loans in the pool were originated.
[2] Approximately 50% of the underlying CMBS CRE CDO collateral are seasoned, below investment grade securities. However, the Company
primarily invests in the AAA tranche of the CDO capital structure.
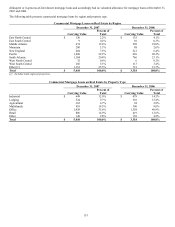
In addition to commercial mortgage-backed securities, the company has whole loan commercial real estate investments. The carrying
value of these investments was $5.4 billion and $3.3 billion as of December 31, 2007 and 2006, respectively. The Company’s mortgage
loans are collateralized by a variety of commercial and agricultural properties. The mortgage loans are geographically dispersed
throughout the United States and by property type. At December 31, 2007 and 2006, the Company held no impaired, restructured,