The Hartford 2007 Annual Report Download - page 151
Download and view the complete annual report
Please find page 151 of the 2007 The Hartford annual report below. You can navigate through the pages in the report by either clicking on the pages listed below, or by using the keyword search tool below to find specific information within the annual report.-
 1
1 -
2
-
3
-
4
-
5
-
6
-
7
-
8
-
9
-
10
-
11
-
12
-
13
-
14
-
15
-
16
-
17
-
18
-
19
-
20
-
21
-
22
-
23
-
24
-
25
-
26
-
27
-
28
-
29
-
30
-
31
-
32
-
33
-
34
-
35
-
36
-
37
-
38
-
39
-
40
-
41
-
42
-
43
-
44
-
45
-
46
-
47
-
48
-
49
-
50
-
51
-
52
-
53
-
54
-
55
-
56
-
57
-
58
-
59
-
60
-
61
-
62
-
63
-
64
-
65
-
66
-
67
-
68
-
69
-
70
-
71
-
72
-
73
-
74
-
75
-
76
-
77
-
78
-
79
-
80
-
81
-
82
-
83
-
84
-
85
-
86
-
87
-
88
-
89
-
90
-
91
-
92
-
93
-
94
-
95
-
96
-
97
-
98
-
99
-
100
-
101
-
102
-
103
-
104
-
105
-
106
-
107
-
108
-
109
-
110
-
111
-
112
-
113
-
114
-
115
-
116
-
117
-
118
-
119
-
120
-
121
-
122
-
123
-
124
-
125
-
126
-
127
-
128
-
129
-
130
-
131
-
132
-
133
-
134
-
135
-
136
-
137
-
138
-
139
-
140
-
 141
141 -
 142
142 -
 143
143 -
 144
144 -
 145
145 -
 146
146 -
 147
147 -
 148
148 -
 149
149 -
 150
150 -
 151
151 -
 152
152 -
 153
153 -
 154
154 -
 155
155 -
 156
156 -
 157
157 -
 158
158 -
 159
159 -
 160
160 -
 161
161 -
162
-
163
-
164
-
165
-
166
-
167
-
168
-
169
-
170
-
171
-
172
-
173
-
174
-
175
-
176
-
177
-
178
-
179
-
180
-
181
-
182
-
183
-
184
-
185
-
186
-
187
-
188
-
189
-
190
-
191
-
192
-
193
-
194
-
195
-
196
-
197
-
198
-
199
-
200
-
201
-
202
-
203
-
204
-
205
-
206
-
207
-
208
-
209
-
210
-
211
-
212
-
213
-
214
-
215
-
216
-
217
-
218
-
219
-
220
-
221
-
222
-
223
-
224
-
225
-
226
-
227
-
228
-
229
-
230
-
231
-
232
-
233
-
234
-
235
-
236
-
237
-
238
-
239
-
240
-
241
-
242
-
243
-
244
-
245
-
246
-
247
-
248
-
249
-
250
-
251
-
252
-
253
-
254
-
255
-
256
-
257
-
258
-
259
-
260
-
261
-
262
-
263
-
264
-
265
-
266
-
267
-
268
-
269
-
270
-
271
-
272
-
273
-
274
-
275
-
276
 |
 |

151
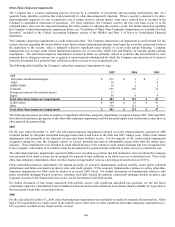
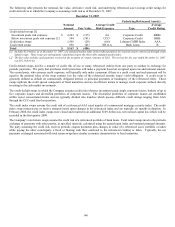
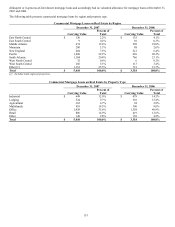
delinquent or in-process-of-foreclosure mortgage loans and accordingly had no valuation allowance for mortgage loans at December 31,
2007 and 2006.
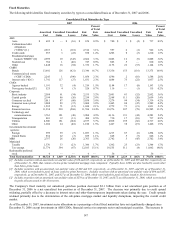
The following table presents commercial mortgage loans by region and property type.
Commercial Mortgage Loans on Real Estate by Region
December 31, 2007 December 31, 2006
Carrying Value
Percent of
Total Carrying Value
Percent of
Total
East North Central $ 120 2.2% $ 135 4.1%
East South Central 9 0.2% 10 0.3%
Middle Atlantic 674 12.4% 598 18.0%
Mountain 200 3.7%
88 2.6%
New England 404 7.5%
212 6.4%
Pacific 1,200 22.2%
669 20.2%
South Atlantic 1,104 20.4%
766 23.1%
West North Central 32 0.6% 6 0.2%
West South Central 286 5.3% 113 3.4%
Other [1] 1,381 25.5%
721 21.7%
Total $ 5,410 100.0% $ 3,318 100.0%
[1] Includes multi-regional properties.
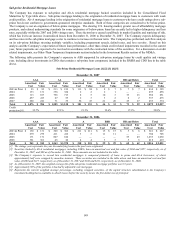
Commercial Mortgage Loans on Real Estate by Property Type
December 31, 2007 December 31, 2006
Carrying Value
Percent of
Total Carrying Value
Percent of
Total
Industrial $ 649 12.0% $ 479 14.5%
Lodging 524 9.7% 510 15.4%
Agricultural 362 6.7% 94 2.8%
Multifamily 991 18.3%
300 9.0%
Office 1,929 35.6%
1,358 40.9%
Retail 806 14.9%
419 12.6%
Other 149 2.8%
158 4.8%
Total $ 5,410 100.0% $ 3,318 100.0%