The Hartford 2007 Annual Report Download - page 43
Download and view the complete annual report
Please find page 43 of the 2007 The Hartford annual report below. You can navigate through the pages in the report by either clicking on the pages listed below, or by using the keyword search tool below to find specific information within the annual report.-
 1
1 -
2
-
3
-
4
-
5
-
6
-
7
-
8
-
9
-
10
-
11
-
12
-
13
-
14
-
15
-
16
-
17
-
18
-
19
-
20
-
21
-
22
-
23
-
24
-
25
-
26
-
27
-
28
-
29
-
30
-
31
-
32
-
 33
33 -
 34
34 -
 35
35 -
 36
36 -
 37
37 -
 38
38 -
 39
39 -
 40
40 -
 41
41 -
 42
42 -
 43
43 -
 44
44 -
 45
45 -
 46
46 -
 47
47 -
 48
48 -
 49
49 -
 50
50 -
 51
51 -
 52
52 -
 53
53 -
54
-
55
-
56
-
57
-
58
-
59
-
60
-
61
-
62
-
63
-
64
-
65
-
66
-
67
-
68
-
69
-
70
-
71
-
72
-
73
-
74
-
75
-
76
-
77
-
78
-
79
-
80
-
81
-
82
-
83
-
84
-
85
-
86
-
87
-
88
-
89
-
90
-
91
-
92
-
93
-
94
-
95
-
96
-
97
-
98
-
99
-
100
-
101
-
102
-
103
-
104
-
105
-
106
-
107
-
108
-
109
-
110
-
111
-
112
-
113
-
114
-
115
-
116
-
117
-
118
-
119
-
120
-
121
-
122
-
123
-
124
-
125
-
126
-
127
-
128
-
129
-
130
-
131
-
132
-
133
-
134
-
135
-
136
-
137
-
138
-
139
-
140
-
141
-
142
-
143
-
144
-
145
-
146
-
147
-
148
-
149
-
150
-
151
-
152
-
153
-
154
-
155
-
156
-
157
-
158
-
159
-
160
-
161
-
162
-
163
-
164
-
165
-
166
-
167
-
168
-
169
-
170
-
171
-
172
-
173
-
174
-
175
-
176
-
177
-
178
-
179
-
180
-
181
-
182
-
183
-
184
-
185
-
186
-
187
-
188
-
189
-
190
-
191
-
192
-
193
-
194
-
195
-
196
-
197
-
198
-
199
-
200
-
201
-
202
-
203
-
204
-
205
-
206
-
207
-
208
-
209
-
210
-
211
-
212
-
213
-
214
-
215
-
216
-
217
-
218
-
219
-
220
-
221
-
222
-
223
-
224
-
225
-
226
-
227
-
228
-
229
-
230
-
231
-
232
-
233
-
234
-
235
-
236
-
237
-
238
-
239
-
240
-
241
-
242
-
243
-
244
-
245
-
246
-
247
-
248
-
249
-
250
-
251
-
252
-
253
-
254
-
255
-
256
-
257
-
258
-
259
-
260
-
261
-
262
-
263
-
264
-
265
-
266
-
267
-
268
-
269
-
270
-
271
-
272
-
273
-
274
-
275
-
276
 |
 |

43
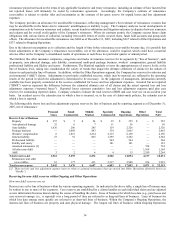
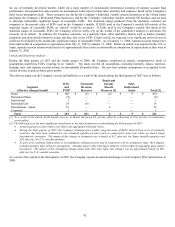
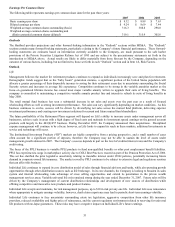
The after-tax impact on the Company’ s assets and liabilities as a result of the unlock during the fourth quarter of 2006 was as follows:
Segment
After-tax (charge) benefit
DAC
and
PVFP
Unearned
Revenue
Reserves
Death and
Income
Benefit
Reserves [1]
Sales
Inducement
Assets
Total
Retail $ (116) $ 5 $ (10) $ 3 $ (118)
Retirement Plans 20 — — — 20
Individual Life (49) 31 — — (18)
International – Japan 26 — 27 — 53
Corporate (13) — — — (13)
Total $ (132) $ 36 $ 17 $ 3 $ (76)
[1] As a result of the unlock, death benefit reserves, in Retail, increased $294, pre-tax, offset by an increase of $279, pre-tax, in reinsurance
recoverables.
The Company performs sensitivity analyses with respect to the effect certain assumptions have on EGPs and the related DAC, sales
inducement, unearned revenue reserve and SOP 03-1 reserve balances. Each of the sensitivities illustrated below are estimated
individually, without consideration for any correlation among the key assumptions. Therefore, it would be inappropriate to take each of
the sensitivity amounts below and add them together in an attempt to estimate volatility for the respective EGP-related balances in total.
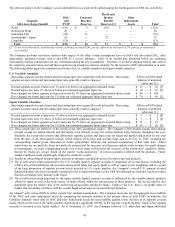
The following tables depict the estimated sensitivities for U.S. variable annuities and Japan variable annuities:
U.S. Variable Annuities
(Increasing separate account returns and decreasing lapse rates generally result in benefits. Decreasing
separate account returns and increasing lapse rates generally result in charges.)
Effect on EGP-related
balances if unlocked
(after-tax) [1]
If actual separate account returns were 1% above or below our aggregated estimated return $ 15 — $ 30 [3]
If actual lapse rates were 1% above or below our estimated aggregate lapse rate $ 10 — $ 25 [2]
If we changed our future separate account return rate by 1% from our aggregated estimated future return $ 80 — $ 100
If we changed our future lapse rate by 1% from our estimated aggregate future lapse rate $ 70 — $ 90 [2]
Japan Variable Annuities
(Increasing separate account returns and decreasing lapse rates generally result in benefits. Decreasing
separate account returns and increasing lapse rates generally result in charges.)
Effect on EGP-related
balances if unlocked
(after-tax) [1]
If actual separate account returns were 1% above or below our aggregated estimated return $ 1 — $ 5 [4]
If actual lapse rates were 1% above or below our estimated aggregate lapse rate $ 1 — $ 5 [2]
If we changed our future separate account return rate by 1% from our aggregated estimated future return $ 15 — $ 25
If we changed our future lapse rate by 1% from our estimated aggregate future lapse rate $ 10 — $ 20 [2]
[1] These sensitivities are reflective of the results of our 2007 assumption studies. The Company’ s EGP models assume that separate
account returns are earned linearly and that lapses occur linearly (except for certain dynamic lapse features) throughout the year.
Similarly, the sensitivities assume that differential separate account and lapse rates are linear and parallel and persist for one year
from the date of our third quarter unlock, which reflects all in-force and account value data as of July 31, 2007, including the
corresponding market levels, allocation of funds, policyholder behavior and actuarial assumptions at that same date. These
sensitivities are not perfectly linear nor perfectly symmetrical for increases and decreases and are most accurate for small changes
in assumptions. As such, extrapolating results over a wide range will decrease the accuracy of the sensitivities’ predictive ability.
Sensitivity results are, in part, based on the current “in-the-moneyness” of various guarantees offered with the products. Future
market conditions could significantly change the sensitivity results.
[2] Sensitivity around lapses assumes lapses increase or decrease consistently across all cohort years and products.
[3] The overall actual return generated by the U.S. variable annuity separate accounts is dependent on several factors, including the
relative mix of the underlying sub-accounts among bond funds and equity funds as well as equity sector weightings and as a result
of the large proportion of separate account assets invested in U.S. equity markets, the Company’ s overall U.S. separate account
fund performance has been reasonably correlated to the overall performance of the S&P 500 although no assurance can be provided
that this correlation will continue in the future.
[4] The overall actual return generated by the Japan variable annuity separate accounts is influenced by the variable annuity products
offered in Japan as well as the wide variety of funds offered within the sub-accounts of those products. The actual return is also
dependent upon the relative mix of the underlying sub-accounts among the funds. Unlike in the U.S., there is no global index or
market that reasonably correlates with the overall Japan actual separate account fund performance.
An “unlock” only revises EGPs to reflect current best estimate assumptions. The Company must also test the aggregate recoverability
of the DAC and sales inducement assets by comparing the amounts deferred to the present value of total EGPs. In addition, the
Company routinely stress tests its DAC and sales inducement assets for recoverability against severe declines in its separate account
assets, which could occur if the equity markets experienced a significant sell-off, as the majority of policyholders’ funds in the separate
accounts is invested in the equity market. As of December 31, 2007, the Company believed U.S. individual and Japan individual