The Hartford 2007 Annual Report Download - page 249
Download and view the complete annual report
Please find page 249 of the 2007 The Hartford annual report below. You can navigate through the pages in the report by either clicking on the pages listed below, or by using the keyword search tool below to find specific information within the annual report.-
 1
1 -
2
-
3
-
4
-
5
-
6
-
7
-
8
-
9
-
10
-
11
-
12
-
13
-
14
-
15
-
16
-
17
-
18
-
19
-
20
-
21
-
22
-
23
-
24
-
25
-
26
-
27
-
28
-
29
-
30
-
31
-
32
-
33
-
34
-
35
-
36
-
37
-
38
-
39
-
40
-
41
-
42
-
43
-
44
-
45
-
46
-
47
-
48
-
49
-
50
-
51
-
52
-
53
-
54
-
55
-
56
-
57
-
58
-
59
-
60
-
61
-
62
-
63
-
64
-
65
-
66
-
67
-
68
-
69
-
70
-
71
-
72
-
73
-
74
-
75
-
76
-
77
-
78
-
79
-
80
-
81
-
82
-
83
-
84
-
85
-
86
-
87
-
88
-
89
-
90
-
91
-
92
-
93
-
94
-
95
-
96
-
97
-
98
-
99
-
100
-
101
-
102
-
103
-
104
-
105
-
106
-
107
-
108
-
109
-
110
-
111
-
112
-
113
-
114
-
115
-
116
-
117
-
118
-
119
-
120
-
121
-
122
-
123
-
124
-
125
-
126
-
127
-
128
-
129
-
130
-
131
-
132
-
133
-
134
-
135
-
136
-
137
-
138
-
139
-
140
-
141
-
142
-
143
-
144
-
145
-
146
-
147
-
148
-
149
-
150
-
151
-
152
-
153
-
154
-
155
-
156
-
157
-
158
-
159
-
160
-
161
-
162
-
163
-
164
-
165
-
166
-
167
-
168
-
169
-
170
-
171
-
172
-
173
-
174
-
175
-
176
-
177
-
178
-
179
-
180
-
181
-
182
-
183
-
184
-
185
-
186
-
187
-
188
-
189
-
190
-
191
-
192
-
193
-
194
-
195
-
196
-
197
-
198
-
199
-
200
-
201
-
202
-
203
-
204
-
205
-
206
-
207
-
208
-
209
-
210
-
211
-
212
-
213
-
214
-
215
-
216
-
217
-
218
-
219
-
220
-
221
-
222
-
223
-
224
-
225
-
226
-
227
-
228
-
229
-
230
-
231
-
232
-
233
-
234
-
235
-
236
-
237
-
238
-
 239
239 -
 240
240 -
 241
241 -
 242
242 -
 243
243 -
 244
244 -
 245
245 -
 246
246 -
 247
247 -
 248
248 -
 249
249 -
 250
250 -
 251
251 -
 252
252 -
 253
253 -
 254
254 -
 255
255 -
 256
256 -
 257
257 -
 258
258 -
 259
259 -
260
-
261
-
262
-
263
-
264
-
265
-
266
-
267
-
268
-
269
-
270
-
271
-
272
-
273
-
274
-
275
-
276
 |
 |

THE HARTFORD FINANCIAL SERVICES GROUP, INC.
NOTES TO CONSOLIDATED FINANCIAL STATEMENTS (continued)
F-72
17. Pension Plans and Postretirement Health Care and Life Insurance Benefit Plans (continued)
Assumed health care cost trend rates were as follows:
As of December 31,
2007 2006 2005
Health care cost trend rate N/A 10.00% 10.00%
Pre-65 Health care cost trend rate 9.30% N/A N/A
Post-65 Health care cost trend rate 7.70% N/A N/A
Rate to which the cost trend rate is assumed to decline (the ultimate trend rate) 5.00% 4.50% 4.50%
Year that the rate reaches the ultimate trend rate 2013 2013 2012
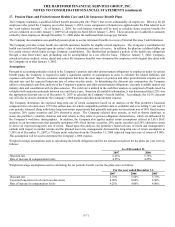
In order to better measure its other postretirement liability and the related assumptions consistent with industry trends and practice, the
company bi-furcated its health care cost trend rate assumptions to assess the pre-65 and post-65 populations separately for the year
ended December 31, 2007.
Assumed health care cost trends have an effect on the amounts reported for the postretirement health care and life insurance benefit
plans. Increasing/decreasing the health care trend rates by one percent each year would have the effect of increasing/decreasing the
benefit obligation as of December 31, 2007 by $6 and the annual net periodic expense for the year then ended by $1.
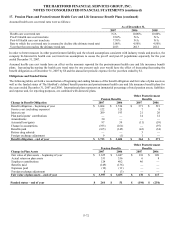
Obligations and Funded Status
The following tables set forth a reconciliation of beginning and ending balances of the benefit obligation and fair value of plan assets as
well as the funded status of The Hartford’s defined benefit pension and postretirement health care and life insurance benefit plans for
the years ended December 31, 2007 and 2006. International plans represent an immaterial percentage of total pension assets, liabilities
and expense and, for reporting purposes, are combined with domestic plans.
Pension Benefits
Other Postretirement
Benefits
Change in Benefit Obligation 2007 2006 2007 2006
Benefit obligation – beginning of year $3,604 $ 3,534 $ 371 $ 521
Service cost (excluding expenses) 122 125 7 8
Interest cost 209 193 21 20
Plan participants’ contributions — — 14 12
Amendments 30 — — —
Actuarial loss/(gain) 97 59 (11) (59)
Change in assumptions (193) (161) — (97)
Benefits paid (165) (145) (42) (34)
Retiree drug subsidy — — 3 —
Foreign exchange adjustment 9 (1) 1 —
Benefit obligation – end of year $3,713 $ 3,604 $ 364 $ 371
Pension Benefits
Other Postretirement
Benefits
Change in Plan Assets 2007 2006 2007 2006
Fair value of plan assets – beginning of year $ 3,655 $ 3,047 $ 118 $ 109
Actual return on plan assets 331 356 6 8
Employer contributions 124 402 46 —
Benefits paid (149) (136) — —
Expenses paid (12) (11) — —
Foreign exchange adjustment 8 (3) — —
Fair value of plan assets – end of year $ 3,957 $ 3,655 $ 170 $ 117
Funded status – end of year $244 $ 51 $ (194) $ (254)