The Hartford 2007 Annual Report Download - page 189
Download and view the complete annual report
Please find page 189 of the 2007 The Hartford annual report below. You can navigate through the pages in the report by either clicking on the pages listed below, or by using the keyword search tool below to find specific information within the annual report.-
 1
1 -
2
-
3
-
4
-
5
-
6
-
7
-
8
-
9
-
10
-
11
-
12
-
13
-
14
-
15
-
16
-
17
-
18
-
19
-
20
-
21
-
22
-
23
-
24
-
25
-
26
-
27
-
28
-
29
-
30
-
31
-
32
-
33
-
34
-
35
-
36
-
37
-
38
-
39
-
40
-
41
-
42
-
43
-
44
-
45
-
46
-
47
-
48
-
49
-
50
-
51
-
52
-
53
-
54
-
55
-
56
-
57
-
58
-
59
-
60
-
61
-
62
-
63
-
64
-
65
-
66
-
67
-
68
-
69
-
70
-
71
-
72
-
73
-
74
-
75
-
76
-
77
-
78
-
79
-
80
-
81
-
82
-
83
-
84
-
85
-
86
-
87
-
88
-
89
-
90
-
91
-
92
-
93
-
94
-
95
-
96
-
97
-
98
-
99
-
100
-
101
-
102
-
103
-
104
-
105
-
106
-
107
-
108
-
109
-
110
-
111
-
112
-
113
-
114
-
115
-
116
-
117
-
118
-
119
-
120
-
121
-
122
-
123
-
124
-
125
-
126
-
127
-
128
-
129
-
130
-
131
-
132
-
133
-
134
-
135
-
136
-
137
-
138
-
139
-
140
-
141
-
142
-
143
-
144
-
145
-
146
-
147
-
148
-
149
-
150
-
151
-
152
-
153
-
154
-
155
-
156
-
157
-
158
-
159
-
160
-
161
-
162
-
163
-
164
-
165
-
166
-
167
-
168
-
169
-
170
-
171
-
172
-
173
-
174
-
175
-
176
-
177
-
178
-
 179
179 -
 180
180 -
 181
181 -
 182
182 -
 183
183 -
 184
184 -
 185
185 -
 186
186 -
 187
187 -
 188
188 -
 189
189 -
 190
190 -
 191
191 -
 192
192 -
 193
193 -
 194
194 -
 195
195 -
 196
196 -
 197
197 -
 198
198 -
 199
199 -
200
-
201
-
202
-
203
-
204
-
205
-
206
-
207
-
208
-
209
-
210
-
211
-
212
-
213
-
214
-
215
-
216
-
217
-
218
-
219
-
220
-
221
-
222
-
223
-
224
-
225
-
226
-
227
-
228
-
229
-
230
-
231
-
232
-
233
-
234
-
235
-
236
-
237
-
238
-
239
-
240
-
241
-
242
-
243
-
244
-
245
-
246
-
247
-
248
-
249
-
250
-
251
-
252
-
253
-
254
-
255
-
256
-
257
-
258
-
259
-
260
-
261
-
262
-
263
-
264
-
265
-
266
-
267
-
268
-
269
-
270
-
271
-
272
-
273
-
274
-
275
-
276
 |
 |
THE HARTFORD FINANCIAL SERVICES GROUP, INC.
NOTES TO CONSOLIDATED FINANCIAL STATEMENTS (continued)
F-12
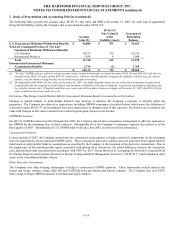
1. Basis of Presentation and Accounting Policies (continued)
Fair Value Measurements
On January 1, 2008, the Company adopted SFAS No. 157, “Fair Value Measurements” (SFAS 157), which was issued by the FASB in
September 2006. For financial statement elements currently required to be measured at fair value, SFAS 157 redefines fair value,
establishes a framework for measuring fair value under U.S. GAAP and enhances disclosures about fair value measurements. The new
definition of fair value focuses on the price that would be received to sell the asset or paid to transfer the liability regardless of whether
an observable liquid market price existed (an exit price). An exit price valuation will include margins for risk even if they are not
observable. As the Company is released from risk, the margins for risk will also be released through net realized capital gains (losses)
in net income. SFAS 157 provides guidance on how to measure fair value, when required, under existing accounting standards. SFAS
157 establishes a fair value hierarchy that prioritizes the inputs to valuation techniques used to measure fair value into three broad
levels (“Level 1, 2, and 3”).
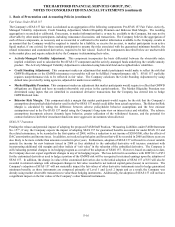
Level 1 Observable inputs that reflect quoted prices for identical assets or liabilities in active markets that the Company has the
ability to access at the measurement date.
Level 2 Observable inputs, other than quoted prices included in Level 1, for the asset or liability or prices for similar assets and
liabilities.
Level 3 Unobservable inputs reflecting the reporting entity’ s estimates of the assumptions that market participants would use in
pricing the asset or liability (including assumptions about risk).
Additional information regarding the valuation of the Company’ s guaranteed benefits products and the adoption of SFAS 157 is
included below.
Accounting for Guaranteed Benefits Offered With Variable Annuities
Many of the variable annuity contracts issued by the Company offer various guaranteed minimum death, withdrawal, income and
accumulation benefits. Those benefits are accounted for under SFAS 133 or AICPA Statement of Position No. 03-1 “Accounting and
Reporting by Insurance Enterprises for Certain Nontraditional Long-Duration Contracts and for Separate Accounts (“SOP 03-1”).
Guaranteed minimum benefits often meet the definition of an embedded derivative under SFAS 133 as they have notional amounts (the
guaranteed balance) and underlyings (the investment fund options), they require no initial net investment and they may have terms that
require or permit net settlement. However, certain guaranteed minimum benefits settle only upon a single insurable event, such as
death (guaranteed minimum death benefits “GMDB”) or living (life contingent portion of guaranteed minimum withdrawal benefits
“GMWB”), and as such are scoped out of SFAS 133 under the “insurance contract exception”. Other guaranteed minimum benefits
require settlement in the form of a long-term financing transaction, such as is typical with guaranteed minimum income benefits
(“GMIB”), and as such do not meet the net settlement requirement in SFAS 133. Guaranteed minimum benefits that do not meet the
requirements of SFAS 133 are accounted for as insurance benefits under SOP 03-1.
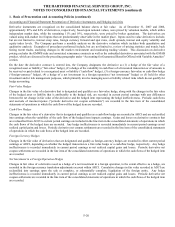
Guaranteed Benefits Accounted For Under SOP 03-1
The Company’ s GMDBs and GMIBs are accounted for under SOP 03-1. In addition, the Company’s GMWB “for life” allows
policyholders to receive the guaranteed annual withdrawal amount for as long as they are alive even if the guaranteed remaining
balance (“GRB”) is exhausted. Payments beyond the GRB are considered life contingent insurance benefits and are accounted for
under SOP 03-1. Benefit guarantee liabilities accounted for under SOP 03-1, absent an unlocking event as described in “Critical
Accounting Estimates” within Management’ s Discussion and Analysis, do not result in a change in value that is immediately reflected
in net income. Under SOP 03-1, the income statement reflects the current period increase in the liability due to the deferral of a
percentage of current period revenues. The percentage is determined by dividing the present value of claims by the present value of
expected revenues using best estimate assumptions over a range of market scenarios discounted at a rate consistent with that used in the
Company’ s DAC models. Current period revenues are impacted by the actual increase or decrease in account value. Claims recorded
against the liability have no immediate impact on the income statement unless those claims exceed the liability. Periodically, the
Company unlocks its benefit assumptions, including the benefit deferral rate. The impact of this change is reflected in benefits, losses
and loss adjustment expenses, in net income.
In the U.S., the Company sells variable annuity contracts that, in addition to the living benefits described above, offer various
guaranteed death benefits. Declines in the equity market may increase the Company’ s net exposure to death benefits under these
contracts. The Company’ s total gross exposure (i.e., before reinsurance) to these U.S. guaranteed death benefits is often referred to as
the net amount at risk. However, the Company will incur these guaranteed death benefit payments in the future only if the policyholder
has an in-the-money guaranteed death benefit at their time of death.