The Hartford 2007 Annual Report Download - page 64
Download and view the complete annual report
Please find page 64 of the 2007 The Hartford annual report below. You can navigate through the pages in the report by either clicking on the pages listed below, or by using the keyword search tool below to find specific information within the annual report. 64
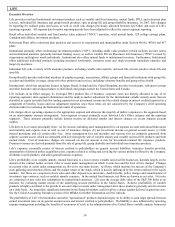
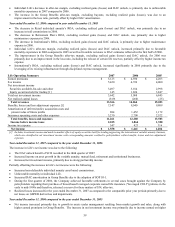
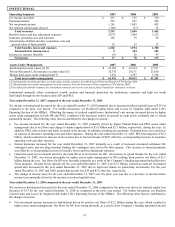
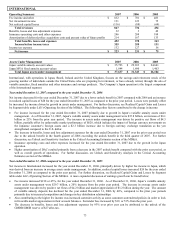
• The effective tax rate increased from 7% to 21% for the year ended December 31, 2007 from the prior year due to an increase in
income before income taxes and revisions in the estimates of the separate account DRD which resulted in an incremental tax of
$17, and foreign tax credits.
Year ended December 31, 2006 compared to the year ended December 31, 2005
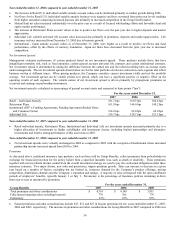
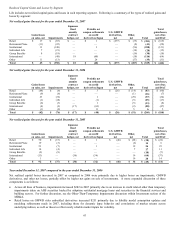
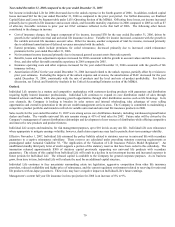
Net income in the Retail segment for the year ended December 31, 2006 decreased primarily due to higher amortization of DAC
resulting from the unlock expense during the fourth quarter of 2006. In addition, realized capital losses increased $49 for the year ended
December 31, 2006 as compared to the prior year period. For further discussion, see Realized Capital Gains and Losses by Segment
table under Life’ s Operating Section of the MD&A. Offsetting these losses was improved fee income driven by higher assets under
management resulting primarily from market growth. The following other factors contributed to the change in income:
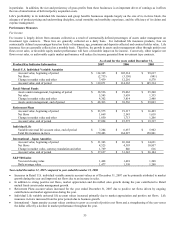
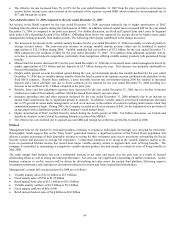
• The increase in fee income in the variable annuity business for the year ended December 31, 2006 was mainly a result of growth in
average account values. The year-over-year increase in average variable annuity account values can be attributed to market
appreciation of $12.2 billion during 2006. Variable annuities had net outflows of $3.2 billion for the year ended December 31,
2006 compared to net outflows of $881 for the year ended December 31, 2005. Net outflows from additional surrender activity
were due to increased deposits competition, particularly from competitors offering variable annuity products with guaranteed living
benefits.
• Mutual fund fee income increased 26% for the year ended December 31, 2006 due to increased assets under management driven by
market appreciation of $3.9 billion and net deposits of $5.7 billion during the year. This increase was primarily attributable to
focused wholesaling efforts.
• Despite stable general account investment spread during the year, net investment income has steadily declined for the year ended
December 31, 2006 due to variable annuity transfers from the fixed account to the separate account combined with surrenders in the
fixed MVA contracts. Despite these outflows, a more favorable interest rate environment during 2006 has resulted in increased
deposits and a lower surrender rate due to fewer contracts up for renewal for the year ended December 31, 2006 resulting in a
decrease in net outflows of $1.3 billion compared to the prior year.
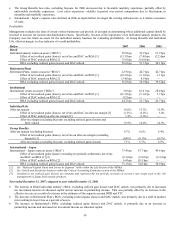
• Benefits, losses and loss adjustment expenses have decreased for the year ended December 31, 2006 due to a decline in interest
credited as a result of fixed annuity outflows which decreased fixed annuity account values.
• Insurance operating costs and other expenses increased for the year ended December 31, 2006 primarily due to an increase in
mutual fund commissions due to significant growth in deposits. In addition, variable annuity asset based commissions increased
due to 9% growth in assets under management, as well as an increase in the number of contracts reaching anniversaries when trail
commission payments begin. During 2005, the Company recorded an after-tax expense of $46, for the termination of a provision of
an agreement with a distribution partner of the Company’ s retail mutual funds.
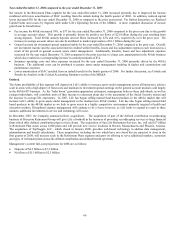
• Higher amortization of DAC resulted from the unlock during the fourth quarter of 2006. For further discussion, see Unlock and
Sensitivity Analysis in the Critical Accounting Estimates section of the MD&A.
• The effective tax rate declined due to separate account DRD and foreign tax credit true-up benefits recorded in 2006.
Outlook
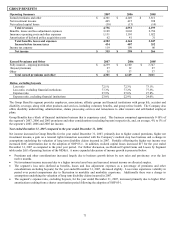
Management believes the market for retirement products continues to expand as individuals increasingly save and plan for retirement.
Demographic trends suggest that as the “baby boom” generation matures, a significant portion of the United States population will
allocate a greater percentage of their disposable incomes to saving for their retirement years due to uncertainty surrounding the Social
Security system and increases in average life expectancy. Competition continues to be strong in the variable annuities market as the
focus on guaranteed lifetime income has caused most major variable annuity writers to upgrade their suite of living benefits. The
company is committed to maintaining a competitive variable annuity product line and intends to refresh its suite of living benefits in
May 2008.
The retail mutual fund business has seen a substantial increase in net sales and assets over the past year as a result of focused
wholesaling efforts as well as strong investment performance. Net sales can vary significantly depending on market conditions. As this
business continues to evolve, success will be driven by diversifying net sales across the mutual fund platform, delivering superior
investment performance and creating new investment solutions for current and future mutual fund shareholders.
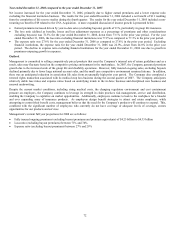
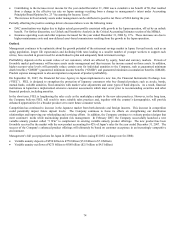
Management’ s current full year projections for 2008 are as follows:
• Variable annuity sales of $12.0 billion to $13.0 billion
• Fixed annuity sales of $750 to $1.25 billion
• Retail mutual fund sales of $13.5 billion to $15.5 billion
• Variable annuity outflows of $4.2 billion to $5.2 billion
• Fixed annuity outflows of $0 to $500
• Retail mutual fund net sales of $4.0 billion to $6.0 billion


