The Hartford 2007 Annual Report Download - page 78
Download and view the complete annual report
Please find page 78 of the 2007 The Hartford annual report below. You can navigate through the pages in the report by either clicking on the pages listed below, or by using the keyword search tool below to find specific information within the annual report.-
 1
1 -
2
-
3
-
4
-
5
-
6
-
7
-
8
-
9
-
10
-
11
-
12
-
13
-
14
-
15
-
16
-
17
-
18
-
19
-
20
-
21
-
22
-
23
-
24
-
25
-
26
-
27
-
28
-
29
-
30
-
31
-
32
-
33
-
34
-
35
-
36
-
37
-
38
-
39
-
40
-
41
-
42
-
43
-
44
-
45
-
46
-
47
-
48
-
49
-
50
-
51
-
52
-
53
-
54
-
55
-
56
-
57
-
58
-
59
-
60
-
61
-
62
-
63
-
64
-
65
-
66
-
67
-
 68
68 -
 69
69 -
 70
70 -
 71
71 -
 72
72 -
 73
73 -
 74
74 -
 75
75 -
 76
76 -
 77
77 -
 78
78 -
 79
79 -
 80
80 -
 81
81 -
 82
82 -
 83
83 -
 84
84 -
 85
85 -
 86
86 -
 87
87 -
 88
88 -
89
-
90
-
91
-
92
-
93
-
94
-
95
-
96
-
97
-
98
-
99
-
100
-
101
-
102
-
103
-
104
-
105
-
106
-
107
-
108
-
109
-
110
-
111
-
112
-
113
-
114
-
115
-
116
-
117
-
118
-
119
-
120
-
121
-
122
-
123
-
124
-
125
-
126
-
127
-
128
-
129
-
130
-
131
-
132
-
133
-
134
-
135
-
136
-
137
-
138
-
139
-
140
-
141
-
142
-
143
-
144
-
145
-
146
-
147
-
148
-
149
-
150
-
151
-
152
-
153
-
154
-
155
-
156
-
157
-
158
-
159
-
160
-
161
-
162
-
163
-
164
-
165
-
166
-
167
-
168
-
169
-
170
-
171
-
172
-
173
-
174
-
175
-
176
-
177
-
178
-
179
-
180
-
181
-
182
-
183
-
184
-
185
-
186
-
187
-
188
-
189
-
190
-
191
-
192
-
193
-
194
-
195
-
196
-
197
-
198
-
199
-
200
-
201
-
202
-
203
-
204
-
205
-
206
-
207
-
208
-
209
-
210
-
211
-
212
-
213
-
214
-
215
-
216
-
217
-
218
-
219
-
220
-
221
-
222
-
223
-
224
-
225
-
226
-
227
-
228
-
229
-
230
-
231
-
232
-
233
-
234
-
235
-
236
-
237
-
238
-
239
-
240
-
241
-
242
-
243
-
244
-
245
-
246
-
247
-
248
-
249
-
250
-
251
-
252
-
253
-
254
-
255
-
256
-
257
-
258
-
259
-
260
-
261
-
262
-
263
-
264
-
265
-
266
-
267
-
268
-
269
-
270
-
271
-
272
-
273
-
274
-
275
-
276
 |
 |

78
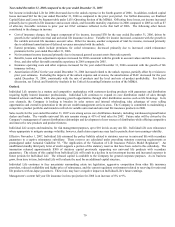
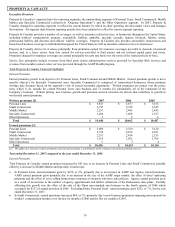
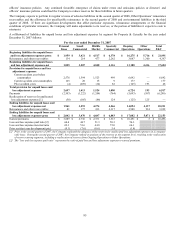
• Excluding Omni, the $267 decrease in Ongoing Operations’ current accident year underwriting results before catastrophes was
primarily due to an increase in the loss and loss adjustment expense ratio before catastrophes and prior accident year development
and an increase in insurance and operating costs and dividends. The increase in the loss and loss adjustment expense ratio before
catastrophes and prior accident year development was primarily due to increased severity on Personal Lines auto liability claims,
increased frequency on Personal Lines auto property damage claims and, to a lesser extent, increased severity on Personal Lines
homeowners claims and a higher loss and loss adjustment expense ratio for both Small Commercial package business and Middle
Market workers’ compensation claims.
• The change to net realized capital losses during 2007 was primarily due to an increase in credit-related impairments and decreases
in the fair value of non-qualifying derivatives attributable to changes in value associated with credit derivatives due to credit
spreads widening. Credit-related impairments in 2007 primarily consisted of impairments of asset-backed securities backed by sub-
prime residential mortgage loans and impairments of corporate securities in the financial services and homebuilders sectors. (See
the Other-Than-Temporary Impairments discussion within Investment Results for more information on the impairments recorded in
2007).
• Primarily driving the $201 increase in net investment income was a higher average invested asset base and income earned from a
higher portfolio yield. The increase in the average invested asset base contributing to the increase in investment income was
primarily due to positive operating cash flows, partially offset by the return of capital to Corporate. Contributing to the increase in
net investment income was an increase in income from limited partnerships and other alternative investments, driven by a higher
yield on these investments and shifting a greater allocation of investments to these asset classes.
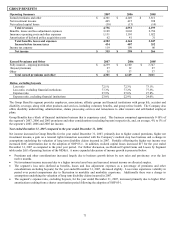
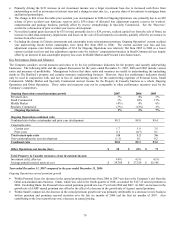
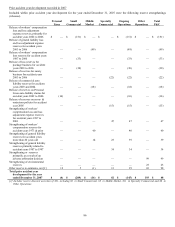
• The $167 decrease in net unfavorable prior accident year development in Other Operations was primarily due to a $243 charge in
2006 to recognize the effect of the Equitas agreement and strengthening of the allowance for uncollectible reinsurance, partially
offset by a $99 strengthening of reserves in 2007, primarily related to an adverse arbitration decision. See the Other Operations
segment discussion of the MD&A for further information of the prior accident year reserve development in each year.
• The $81 increase in net favorable prior accident year development in Ongoing Operations was primarily due to $151 release of
workers’ compensation loss and loss adjustment expenses reserves in 2007, partially offset by an $83 net release of prior accident
year hurricane reserves in 2006. Refer to the “Reserves” section of the MD&A for further discussion.
• The $26 increase in other expenses was primarily due to $49 of interest charged by Corporate on the amount of capital held by the
Property & Casualty operation in excess of the amount needed to support the capital requirements of the Property & Casualty
operation, partially offset by a reduction in the estimated cost of legal settlements in 2007.
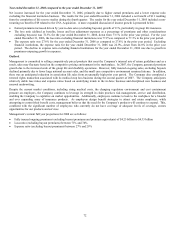
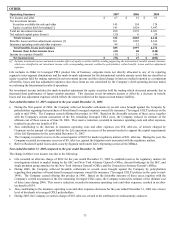
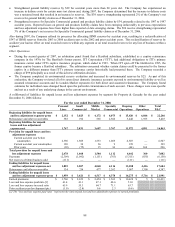
Year ended December 31, 2006 compared to the year ended December 31, 2005
Net income increased $283 for the year ended December 31, 2006, primarily due to:
Income
before
income tax
Net
income
2005 $ 1,720 $ 1,236
A decrease in current accident year catastrophe losses 152 99
An increase in Other Operations’ net unfavorable prior accident year reserve development (148) (96)
An increase in net investment income 121 91
A $41 reduction of estimated Citizens’ assessments in 2006 related to the 2005 hurricanes compared to a
charge of $64 for Citizens assessments in 2005 related to the 2005 and 2004 hurricanes
105
68
A change to $64 of net favorable prior accident year reserve development in Ongoing Operations 100 65
An increase in current accident year underwriting results due to catastrophe treaty reinstatement premium
recorded as a reduction of earned premium in 2005
73
47
Gain from the sale of Omni, including income tax benefit of $49 (24) 25
An increase in other expenses, primarily due to lower bad debt expense in 2005 (20) (13)
Excluding the gain from the sale of Omni, a decrease in net realized capital gains from $44 in 2005 to $33
in 2006
(11)
(8)
Excluding the change in Citizens assessments and catastrophe treaty reinstatement premium, a decrease in
Ongoing Operations’ current accident year underwriting results before catastrophes
(10)
(7)
Other changes, net 12 12
Net increase in income for 2006 350 283
2006 $ 2,070 $ 1,519
• The $152 decrease in current accident year catastrophe losses was largely due to $264 of losses in 2005 related to hurricanes
Katrina, Rita and Wilma, partially offset by an increase in non-hurricane catastrophe losses in 2006.
• The $148 increase in net unfavorable prior accident year development in Other Operations was primarily due to a $243 reduction of
reinsurance recoverables in 2006 resulting from an agreement with Equitas and the Company’ s evaluation of the reinsurance
recoverables and allowance for uncollectible reinsurance associated with older, long-term casualty liabilities.