The Hartford 2007 Annual Report Download - page 250
Download and view the complete annual report
Please find page 250 of the 2007 The Hartford annual report below. You can navigate through the pages in the report by either clicking on the pages listed below, or by using the keyword search tool below to find specific information within the annual report.-
 1
1 -
2
-
3
-
4
-
5
-
6
-
7
-
8
-
9
-
10
-
11
-
12
-
13
-
14
-
15
-
16
-
17
-
18
-
19
-
20
-
21
-
22
-
23
-
24
-
25
-
26
-
27
-
28
-
29
-
30
-
31
-
32
-
33
-
34
-
35
-
36
-
37
-
38
-
39
-
40
-
41
-
42
-
43
-
44
-
45
-
46
-
47
-
48
-
49
-
50
-
51
-
52
-
53
-
54
-
55
-
56
-
57
-
58
-
59
-
60
-
61
-
62
-
63
-
64
-
65
-
66
-
67
-
68
-
69
-
70
-
71
-
72
-
73
-
74
-
75
-
76
-
77
-
78
-
79
-
80
-
81
-
82
-
83
-
84
-
85
-
86
-
87
-
88
-
89
-
90
-
91
-
92
-
93
-
94
-
95
-
96
-
97
-
98
-
99
-
100
-
101
-
102
-
103
-
104
-
105
-
106
-
107
-
108
-
109
-
110
-
111
-
112
-
113
-
114
-
115
-
116
-
117
-
118
-
119
-
120
-
121
-
122
-
123
-
124
-
125
-
126
-
127
-
128
-
129
-
130
-
131
-
132
-
133
-
134
-
135
-
136
-
137
-
138
-
139
-
140
-
141
-
142
-
143
-
144
-
145
-
146
-
147
-
148
-
149
-
150
-
151
-
152
-
153
-
154
-
155
-
156
-
157
-
158
-
159
-
160
-
161
-
162
-
163
-
164
-
165
-
166
-
167
-
168
-
169
-
170
-
171
-
172
-
173
-
174
-
175
-
176
-
177
-
178
-
179
-
180
-
181
-
182
-
183
-
184
-
185
-
186
-
187
-
188
-
189
-
190
-
191
-
192
-
193
-
194
-
195
-
196
-
197
-
198
-
199
-
200
-
201
-
202
-
203
-
204
-
205
-
206
-
207
-
208
-
209
-
210
-
211
-
212
-
213
-
214
-
215
-
216
-
217
-
218
-
219
-
220
-
221
-
222
-
223
-
224
-
225
-
226
-
227
-
228
-
229
-
230
-
231
-
232
-
233
-
234
-
235
-
236
-
237
-
238
-
239
-
 240
240 -
 241
241 -
 242
242 -
 243
243 -
 244
244 -
 245
245 -
 246
246 -
 247
247 -
 248
248 -
 249
249 -
 250
250 -
 251
251 -
 252
252 -
 253
253 -
 254
254 -
 255
255 -
 256
256 -
 257
257 -
 258
258 -
 259
259 -
 260
260 -
261
-
262
-
263
-
264
-
265
-
266
-
267
-
268
-
269
-
270
-
271
-
272
-
273
-
274
-
275
-
276
 |
 |

THE HARTFORD FINANCIAL SERVICES GROUP, INC.
NOTES TO CONSOLIDATED FINANCIAL STATEMENTS (continued)
F-73
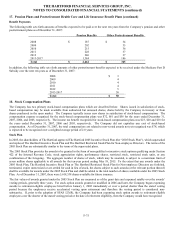
17. Pension Plans and Postretirement Health Care and Life Insurance Benefit Plans (continued)
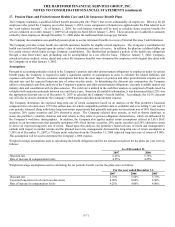
The fair value of assets for pension benefits, and hence the funded status, presented in the table above exclude assets of $138 and $94
held in rabbi trusts and designated for the non-qualified pension plans as of December 31, 2007 and 2006, respectively. The increase in
the assets held in rabbi trusts is primarily due to a $34 contribution made by the Company in December 2007. The assets do not qualify
as plan assets and, therefore, have been excluded from the table above. The assets consist of equity and fixed income securities and are
available to pay benefits for certain retired, terminated and active participants. Such assets are available to the Company’ s general
creditors in the event of insolvency. To the extent the fair value of these trusts were included in the table above, pension plan assets
would have been $4,095 and $3,749 as of December 31, 2007 and 2006, respectively, and the funded status of pension benefits would
have been $382 and $145 as of December 31, 2007 and 2006, respectively.
The accumulated benefit obligation for all defined benefit pension plans was $3,655 and $3,486 as of December 31, 2007 and 2006,
respectively.
The following table provides information for The Hartford’ s defined benefit pension plans with an accumulated benefit obligation in
excess of plan assets as of December 31, 2007 and 2006.
2007 2006
Projected benefit obligation $ 262 $ 223
Accumulated benefit obligation 256 211
Fair value of plan assets — —
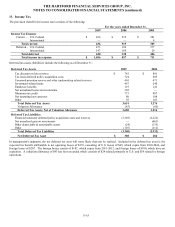
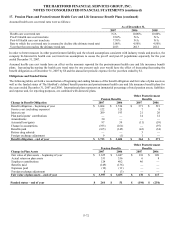
Components of Net Periodic Benefit Cost
Total net periodic benefit cost for the years ended December 31, 2007, 2006 and 2005 include the following components:
Pension Benefits Other Postretirement Benefits
2007 2006 2005 2007 2006 2005
Service cost $ 128 $ 128 $ 116 $ 7 $ 8 $ 12
Interest cost 209 193 182 21 20 27
Expected return on plan assets (283) (244) (221) (8) (8) (9)
Amortization of prior service credit (13) (13) (13) (6) (23) (23)
Amortization of actuarial loss 90 88 73 — — 5
Net periodic benefit cost $ 131 $ 152 $ 137 $ 14 $ (3) $ 12
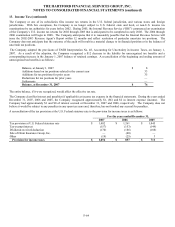
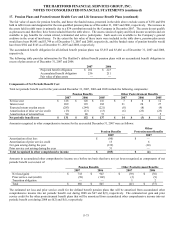
Amounts recognized in other comprehensive income for the year ended December 31, 2007 were as follows:
Pension Benefits
Other
Postretirement Benefits
2007 2007
Amortization of net loss $ (90) $ —
Amortization of prior service credit 13 6
Net gain arising during the year (139) (10)
Prior service cost arising during the year 31 —
Total recognized in other comprehensive income $ (185) $ (4)
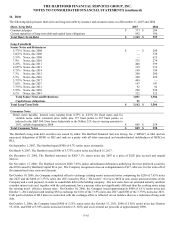
Amounts in accumulated other comprehensive income on a before tax basis that have not yet been recognized as components of net
periodic benefit cost consist of:
Pension Benefits Other Postretirement Benefits
2007 2006 2007 2006
Net loss/(gain) $ 718 $ 947 $ (39) $ (30)
Prior service cost/(credit) (58) (102) (3) (9)
Transition obligation — — 1 2
Total $ 660 $ 845 $ (41) $ (37)
The estimated net loss and prior service credit for the defined benefit pension plans that will be amortized from accumulated other
comprehensive income into net periodic benefit cost during 2008 are $47 and $(9), respectively. The estimated net gain and prior
service credit for the other postretirement benefit plans that will be amortized from accumulated other comprehensive income into net
periodic benefit cost during 2008 are $(2) and $(1), respectively.