The Hartford 2007 Annual Report Download - page 134
Download and view the complete annual report
Please find page 134 of the 2007 The Hartford annual report below. You can navigate through the pages in the report by either clicking on the pages listed below, or by using the keyword search tool below to find specific information within the annual report.-
 1
1 -
2
-
3
-
4
-
5
-
6
-
7
-
8
-
9
-
10
-
11
-
12
-
13
-
14
-
15
-
16
-
17
-
18
-
19
-
20
-
21
-
22
-
23
-
24
-
25
-
26
-
27
-
28
-
29
-
30
-
31
-
32
-
33
-
34
-
35
-
36
-
37
-
38
-
39
-
40
-
41
-
42
-
43
-
44
-
45
-
46
-
47
-
48
-
49
-
50
-
51
-
52
-
53
-
54
-
55
-
56
-
57
-
58
-
59
-
60
-
61
-
62
-
63
-
64
-
65
-
66
-
67
-
68
-
69
-
70
-
71
-
72
-
73
-
74
-
75
-
76
-
77
-
78
-
79
-
80
-
81
-
82
-
83
-
84
-
85
-
86
-
87
-
88
-
89
-
90
-
91
-
92
-
93
-
94
-
95
-
96
-
97
-
98
-
99
-
100
-
101
-
102
-
103
-
104
-
105
-
106
-
107
-
108
-
109
-
110
-
111
-
112
-
113
-
114
-
115
-
116
-
117
-
118
-
119
-
120
-
121
-
122
-
123
-
 124
124 -
 125
125 -
 126
126 -
 127
127 -
 128
128 -
 129
129 -
 130
130 -
 131
131 -
 132
132 -
 133
133 -
 134
134 -
 135
135 -
 136
136 -
 137
137 -
 138
138 -
 139
139 -
 140
140 -
 141
141 -
 142
142 -
 143
143 -
 144
144 -
145
-
146
-
147
-
148
-
149
-
150
-
151
-
152
-
153
-
154
-
155
-
156
-
157
-
158
-
159
-
160
-
161
-
162
-
163
-
164
-
165
-
166
-
167
-
168
-
169
-
170
-
171
-
172
-
173
-
174
-
175
-
176
-
177
-
178
-
179
-
180
-
181
-
182
-
183
-
184
-
185
-
186
-
187
-
188
-
189
-
190
-
191
-
192
-
193
-
194
-
195
-
196
-
197
-
198
-
199
-
200
-
201
-
202
-
203
-
204
-
205
-
206
-
207
-
208
-
209
-
210
-
211
-
212
-
213
-
214
-
215
-
216
-
217
-
218
-
219
-
220
-
221
-
222
-
223
-
224
-
225
-
226
-
227
-
228
-
229
-
230
-
231
-
232
-
233
-
234
-
235
-
236
-
237
-
238
-
239
-
240
-
241
-
242
-
243
-
244
-
245
-
246
-
247
-
248
-
249
-
250
-
251
-
252
-
253
-
254
-
255
-
256
-
257
-
258
-
259
-
260
-
261
-
262
-
263
-
264
-
265
-
266
-
267
-
268
-
269
-
270
-
271
-
272
-
273
-
274
-
275
-
276
 |
 |

134
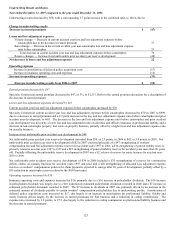
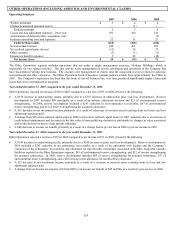
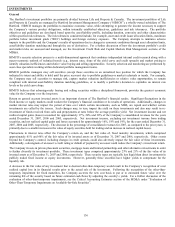
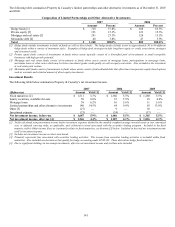
The following table sets forth, for the years ended December 31, 2007, 2006 and 2005, paid and incurred loss activity by the three
categories of claims for asbestos and environmental.
Paid and Incurred Losses and Loss Adjustment Expenses (“LAE”) Development – Asbestos and Environmental
Asbestos [1] Environmental [1]
2007
Paid
Losses & LAE
Incurred
Losses & LAE
Paid
Losses & LAE
Incurred
Losses & LAE
Gross
Direct $ 251 $ (289) $ 90 $ 43
Assumed – Domestic 112 72 16 —
London Market 31 76 8 —
Total 394 (141) 114 43
Ceded (107) 184 (21) (15)
Net $ 287 $ 43 $ 93 $ 28
2006
Gross
Direct $ 346 $ 5 $ 45 $ 57
Assumed – Domestic 199 4 50 (25)
London Market 66 — 9 3
Total 611 9 104 35
Ceded (248) 305 2 27
Net $ 363 $ 314 $ 106 $ 62
2005
Gross
Direct $ 349 $ 10 $ 50 $ 14
Assumed – Domestic 70 (4) 21 —
London Market 61 — 9 —
Total 480 6 80 14
Ceded (271) 23 (3) 38
Net $ 209 $ 29 $ 77 $ 52
[1] Excludes asbestos and environmental paid and incurred loss and LAE reported in Ongoing Operations. Total gross losses and LAE incurred in
Ongoing Operations for the twelve months ended December 31, 2007, 2006, and 2005 includes $9, $10 and $17, respectively, related to asbestos
and environmental claims. Total gross losses and LAE paid in Ongoing Operations for the twelve months ended December 31, 2007, 2006, and
2005 includes $10, $12 and $23, respectively, related to asbestos and environmental claims.
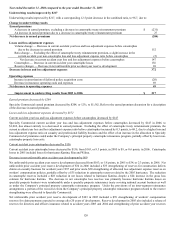
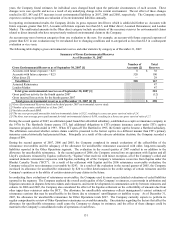
A number of factors affect the variability of estimates for asbestos and environmental reserves including assumptions with respect to the
frequency of claims, the average severity of those claims settled with payment, the dismissal rate of claims with no payment and the
expense to indemnity ratio. The uncertainty with respect to the underlying reserve assumptions for asbestos and environmental adds a
greater degree of variability to these reserve estimates than reserve estimates for more traditional exposures. While this variability is
reflected in part in the size of the range of reserves developed by the Company, that range may still not be indicative of the potential
variance between the ultimate outcome and the recorded reserves. The recorded net reserves as of December 31, 2007 of $2.26 billion
($2.00 billion and $257 for asbestos and environmental, respectively) is within an estimated range, unadjusted for covariance, of $1.88
billion to $2.60 billion. The process of estimating asbestos and environmental reserves remains subject to a wide variety of
uncertainties, which are detailed in the “Critical Accounting Estimates—Property & Casualty Reserves, Net of Reinsurance” section of
Management’ s Discussion and Analysis of Financial Condition and Results of Operations. The Company believes that its current
asbestos and environmental reserves are reasonable and appropriate. However, analyses of further developments could cause the
Company to change its estimates and ranges of its asbestos and environmental reserves, and the effect of these changes could be
material to the Company’ s consolidated operating results, financial condition and liquidity. If there are significant developments that
affect particular exposures, reinsurance arrangements or the financial condition of particular reinsurers, the Company will make
adjustments to its reserves or to the amounts recoverable from its reinsurers.
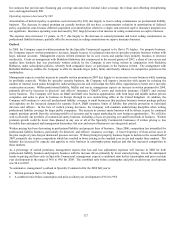
Consistent with the Company’ s long-standing reserving practices, the Company will continue to review and monitor its reserves in the
Other Operations segment regularly and, where future developments indicate, make appropriate adjustments to the reserves. For a
discussion of the Company’ s reserving practices, please see the “Critical Accounting Estimates—Property & Casualty Reserves, Net of
Reinsurance” section of Management’ s Discussion and Analysis of Financial Condition and Results of Operations.