The Hartford 2007 Annual Report Download - page 251
Download and view the complete annual report
Please find page 251 of the 2007 The Hartford annual report below. You can navigate through the pages in the report by either clicking on the pages listed below, or by using the keyword search tool below to find specific information within the annual report.-
 1
1 -
2
-
3
-
4
-
5
-
6
-
7
-
8
-
9
-
10
-
11
-
12
-
13
-
14
-
15
-
16
-
17
-
18
-
19
-
20
-
21
-
22
-
23
-
24
-
25
-
26
-
27
-
28
-
29
-
30
-
31
-
32
-
33
-
34
-
35
-
36
-
37
-
38
-
39
-
40
-
41
-
42
-
43
-
44
-
45
-
46
-
47
-
48
-
49
-
50
-
51
-
52
-
53
-
54
-
55
-
56
-
57
-
58
-
59
-
60
-
61
-
62
-
63
-
64
-
65
-
66
-
67
-
68
-
69
-
70
-
71
-
72
-
73
-
74
-
75
-
76
-
77
-
78
-
79
-
80
-
81
-
82
-
83
-
84
-
85
-
86
-
87
-
88
-
89
-
90
-
91
-
92
-
93
-
94
-
95
-
96
-
97
-
98
-
99
-
100
-
101
-
102
-
103
-
104
-
105
-
106
-
107
-
108
-
109
-
110
-
111
-
112
-
113
-
114
-
115
-
116
-
117
-
118
-
119
-
120
-
121
-
122
-
123
-
124
-
125
-
126
-
127
-
128
-
129
-
130
-
131
-
132
-
133
-
134
-
135
-
136
-
137
-
138
-
139
-
140
-
141
-
142
-
143
-
144
-
145
-
146
-
147
-
148
-
149
-
150
-
151
-
152
-
153
-
154
-
155
-
156
-
157
-
158
-
159
-
160
-
161
-
162
-
163
-
164
-
165
-
166
-
167
-
168
-
169
-
170
-
171
-
172
-
173
-
174
-
175
-
176
-
177
-
178
-
179
-
180
-
181
-
182
-
183
-
184
-
185
-
186
-
187
-
188
-
189
-
190
-
191
-
192
-
193
-
194
-
195
-
196
-
197
-
198
-
199
-
200
-
201
-
202
-
203
-
204
-
205
-
206
-
207
-
208
-
209
-
210
-
211
-
212
-
213
-
214
-
215
-
216
-
217
-
218
-
219
-
220
-
221
-
222
-
223
-
224
-
225
-
226
-
227
-
228
-
229
-
230
-
231
-
232
-
233
-
234
-
235
-
236
-
237
-
238
-
239
-
240
-
 241
241 -
 242
242 -
 243
243 -
 244
244 -
 245
245 -
 246
246 -
 247
247 -
 248
248 -
 249
249 -
 250
250 -
 251
251 -
 252
252 -
 253
253 -
 254
254 -
 255
255 -
 256
256 -
 257
257 -
 258
258 -
 259
259 -
 260
260 -
 261
261 -
262
-
263
-
264
-
265
-
266
-
267
-
268
-
269
-
270
-
271
-
272
-
273
-
274
-
275
-
276
 |
 |

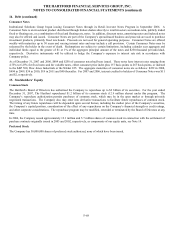
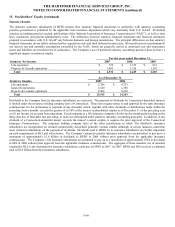
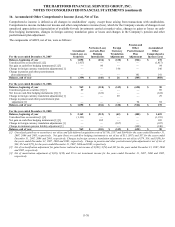
THE HARTFORD FINANCIAL SERVICES GROUP, INC.
NOTES TO CONSOLIDATED FINANCIAL STATEMENTS (continued)
F-74
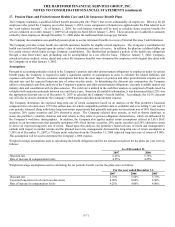
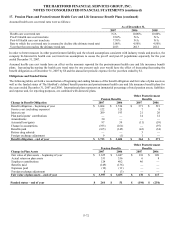
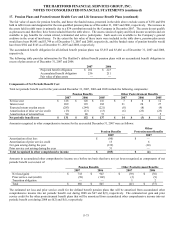
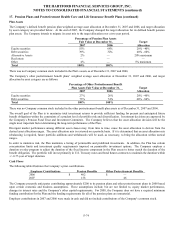
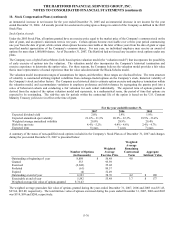
17. Pension Plans and Postretirement Health Care and Life Insurance Benefit Plans (continued)
Plan Assets
The Company’ s defined benefit pension plan weighted average asset allocation at December 31, 2007 and 2006, and target allocation
by asset category are provided below. At the end of 2007, the Company changed the target allocation for its defined benefit pension
plan assets. The Company intends to migrate its asset mix to the target allocation over a two year period.
Percentage of Pension Plan Assets
Fair Value at December 31,
2007 2006
Target
Allocation
Equity securities 55% 68% 20% - 40%
Debt securities 39% 32% 40% - 60%
Alternative Assets 2% — 20% maximum
Real estate — — —
Other 4% — 5% maximum
Total 100% 100%
There was no Company common stock included in the Plan’ s assets as of December 31, 2007 and 2006.
The Company’ s other postretirement benefit plans’ weighted average asset allocation at December 31, 2007 and 2006, and target
allocation by asset category are as follows:
Percentage of Other Postretirement Benefit
Plan Assets Fair Value at December 31,
2007 2006
Target
Allocation
Equity securities 27% 26% 20% - 40%
Debt securities 73% 74% 60% - 80%
Total 100% 100%
There was no Company common stock included in the other postretirement benefit plan assets as of December 31, 2007 and 2006.
The overall goal of the Plan is to maximize total investment returns to provide sufficient funding for present and anticipated future
benefit obligations within the constraints of a prudent level of portfolio risk and diversification. Investment decisions are approved by
the Company’ s Pension Fund Trust and Investment Committee. The Company believes that the asset allocation decision will be the
single most important factor determining the long-term performance of the Plan.
Divergent market performance among different asset classes may, from time to time, cause the asset allocation to deviate from the
desired asset allocation ranges. The asset allocation mix is reviewed on a periodic basis. If it is determined that an asset allocation mix
rebalancing is required, future portfolio additions and withdrawals will be used, as necessary, to bring the allocation within tactical
ranges.
In order to minimize risk, the Plan maintains a listing of permissible and prohibited investments. In addition, the Plan has certain
concentration limits and investment quality requirements imposed on permissible investment options. The Company employs a
duration overlay program to adjust the duration of the fixed income component in the Plan assets to better match the duration of the
benefit obligation. The portfolio will invest primarily in U.S. Treasury notes and bond futures contracts to maintain the duration within
+/- 0.75 year of target duration.
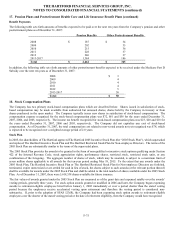
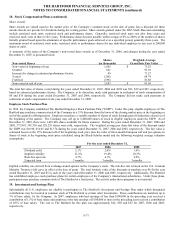
Cash Flows
The following table illustrates the Company’ s prior contributions.
Employer Contributions Pension Benefits Other Postretirement Benefits
2006 $ 402 $ —
2007 158 46
The Company presently anticipates contributing approximately $200 to its pension plans and other postretirement plans in 2008 based
upon certain economic and business assumptions. These assumptions include, but are not limited to, equity market performance,
changes in interest rates and the Company’ s other capital requirements. For 2008, the Company does not have a required minimum
funding contribution for the Plan and the funding requirements for all of the pension plans are immaterial.
Employer contributions in 2007 and 2006 were made in cash and did not include contributions of the Company’s common stock.