The Hartford 2007 Annual Report Download - page 147
Download and view the complete annual report
Please find page 147 of the 2007 The Hartford annual report below. You can navigate through the pages in the report by either clicking on the pages listed below, or by using the keyword search tool below to find specific information within the annual report.-
 1
1 -
2
-
3
-
4
-
5
-
6
-
7
-
8
-
9
-
10
-
11
-
12
-
13
-
14
-
15
-
16
-
17
-
18
-
19
-
20
-
21
-
22
-
23
-
24
-
25
-
26
-
27
-
28
-
29
-
30
-
31
-
32
-
33
-
34
-
35
-
36
-
37
-
38
-
39
-
40
-
41
-
42
-
43
-
44
-
45
-
46
-
47
-
48
-
49
-
50
-
51
-
52
-
53
-
54
-
55
-
56
-
57
-
58
-
59
-
60
-
61
-
62
-
63
-
64
-
65
-
66
-
67
-
68
-
69
-
70
-
71
-
72
-
73
-
74
-
75
-
76
-
77
-
78
-
79
-
80
-
81
-
82
-
83
-
84
-
85
-
86
-
87
-
88
-
89
-
90
-
91
-
92
-
93
-
94
-
95
-
96
-
97
-
98
-
99
-
100
-
101
-
102
-
103
-
104
-
105
-
106
-
107
-
108
-
109
-
110
-
111
-
112
-
113
-
114
-
115
-
116
-
117
-
118
-
119
-
120
-
121
-
122
-
123
-
124
-
125
-
126
-
127
-
128
-
129
-
130
-
131
-
132
-
133
-
134
-
135
-
136
-
 137
137 -
 138
138 -
 139
139 -
 140
140 -
 141
141 -
 142
142 -
 143
143 -
 144
144 -
 145
145 -
 146
146 -
 147
147 -
 148
148 -
 149
149 -
 150
150 -
 151
151 -
 152
152 -
 153
153 -
 154
154 -
 155
155 -
 156
156 -
 157
157 -
158
-
159
-
160
-
161
-
162
-
163
-
164
-
165
-
166
-
167
-
168
-
169
-
170
-
171
-
172
-
173
-
174
-
175
-
176
-
177
-
178
-
179
-
180
-
181
-
182
-
183
-
184
-
185
-
186
-
187
-
188
-
189
-
190
-
191
-
192
-
193
-
194
-
195
-
196
-
197
-
198
-
199
-
200
-
201
-
202
-
203
-
204
-
205
-
206
-
207
-
208
-
209
-
210
-
211
-
212
-
213
-
214
-
215
-
216
-
217
-
218
-
219
-
220
-
221
-
222
-
223
-
224
-
225
-
226
-
227
-
228
-
229
-
230
-
231
-
232
-
233
-
234
-
235
-
236
-
237
-
238
-
239
-
240
-
241
-
242
-
243
-
244
-
245
-
246
-
247
-
248
-
249
-
250
-
251
-
252
-
253
-
254
-
255
-
256
-
257
-
258
-
259
-
260
-
261
-
262
-
263
-
264
-
265
-
266
-
267
-
268
-
269
-
270
-
271
-
272
-
273
-
274
-
275
-
276
 |
 |

147
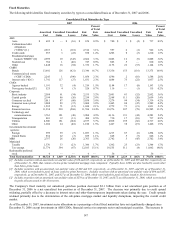
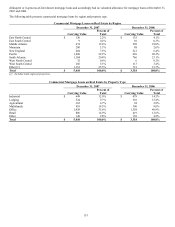
Fixed Maturities
The following table identifies fixed maturity securities by type on a consolidated basis as of December 31, 2007 and 2006.
Consolidated Fixed Maturities by Type
2007
2006
Amortized
Cost
Unrealized
Gains
Unrealized
Losses
Fair
Value
Percent
of Total
Fair
Value
Amortized
Cost
Unrealized
Gains
Unrealized
Losses
Fair
Value
Percent
of Total
Fair
Value
ABS
Auto $ 692 $ — $ (16) $ 676 0.9% $ 740 $ 1 $ (4) $ 737 0.9%
Collateralized debt
obligations
(“CDOs”) [1] 2,633 1 (118) 2,516 3.1% 957 6 (1) 962 1.2%
Credit cards 957 3 (22) 938 1.2% 1,205 8 (3) 1,210 1.5%
Residential mortgage
backed (“RMBS”) [2] 2,999 10 (343) 2,666 3.3% 2,805 12 (9) 2,808 3.6%
Student loan 786 1 (40) 747 0.9% 805 5 — 810 1.0%
Other 1,448 18 (94) 1,372 1.7% 1,175 22 (33) 1,164 1.5%
CMBS
Bonds 13,641 126 (421) 13,346 16.7% 13,336 155 (116) 13,375 16.9%
Commercial real estate
(“CRE”) CDOs 2,243 1 (390) 1,854 2.3% 1,596 2 (10) 1,588 2.0%
Interest only (“IOs”) 1,741 117 (27) 1,831 2.3% 1,884 75 (22) 1,937 2.5%
CMOs
Agency backed 1,191 32 (4) 1,219 1.5% 1,184 17 (8) 1,193 1.5%
Non-agency backed [3] 525 4 (3) 526 0.7% 116 — (1) 115 0.2%
Corporate
Basic industry 2,508 61 (34) 2,535 3.2% 2,801 83 (32) 2,852 3.6%
Capital goods 2,194 86 (26) 2,254 2.8% 2,568 111 (20) 2,659 3.4%
Consumer cyclical 3,011 87 (60) 3,038 3.8% 3,279 94 (34) 3,339 4.2%
Consumer non-cyclical 3,008 89 (37) 3,060 3.8% 3,465 84 (47) 3,502 4.4%
Energy 1,595 71 (12) 1,654 2.1% 1,779 73 (21) 1,831 2.3%
Financial services 11,934 230 (568) 11,596 14.4% 10,276 307 (78) 10,505 13.3%
Technology and
communications 3,763 181 (40) 3,904 4.9% 4,136 191 (44) 4,283 5.4%
Transportation 401 12 (13) 400 0.5% 730 17 (10) 737 0.9%
Utilities 4,500 181 (104) 4,577 5.7% 4,588 195 (66) 4,717 6.0%
Other 1,204 24 (48) 1,180 1.5% 1,447 38 (19) 1,466 1.9%
Government/Government
agencies
Foreign 999 59 (5) 1,053 1.3% 1,213 87 (6) 1,294 1.6%
United States 836 22 (3) 855 1.1% 848 5 (7) 846 1.1%
MBS 2,757 26 (20) 2,763 3.5% 2,742 5 (45) 2,702 3.4%
Municipal
Taxable 1,376 33 (23) 1,386 1.7% 1,342 25 (23) 1,344 1.7%
Tax-exempt 11,776 394 (67) 12,103 15.1% 10,555 511 (4) 11,062 14.0%
Redeemable preferred
stock 6 — — 6 — 36 — — 36 —
Total fixed maturities $ 80,724 $ 1,869 $ (2,538) $ 80,055 100.0% $ 77,608 $ 2,129 $ (663) $ 79,074 100.0%
[1] Includes securities with an amortized cost and fair value of $16 and $15, respectively, as of December 31, 2007, and $59 and $61, respectively, as
of December 31, 2006, that contain a below-prime residential mortgage loan component. Typically these CDOs are also backed by assets other
than below-prime loans.
[2] Includes securities with an amortized cost and fair value of $40 and $37, respectively, as of December 31, 2007, and $21 as of December 31,
2006, which were backed by pools of loans issued to prime borrowers. Includes securities with an amortized cost and fair value of $96 and $87,
respectively, as of December 31, 2007, and $27 as of December 31, 2006, which were backed by pools of loans issued to Alt-A borrowers.
[3] Includes securities with an amortized cost and fair value of $270 as of December 31, 2007, and $72 as of December 31, 2006, which were backed
by pools of loans issued to Alt-A borrowers.
The Company's fixed maturity net unrealized gain/loss position decreased $2.1 billion from a net unrealized gain position as of
December 31, 2006 to a net unrealized loss position as of December 31, 2007. The decrease was primarily due to credit spread
widening, partially offset by a decrease in interest rates and other-than-temporary impairments taken during the year. Credit spreads
widened primarily due to the deterioration of the sub-prime mortgage market and liquidity disruptions, impacting the overall credit
market.
As of December 31, 2007, investment sector allocations as a percentage of total fixed maturities have not significantly changed since
December 31, 2006 except investments in ABS CDOs, financial services in corporate sector and municipal securities. The increase in