The Hartford 2007 Annual Report Download - page 149
Download and view the complete annual report
Please find page 149 of the 2007 The Hartford annual report below. You can navigate through the pages in the report by either clicking on the pages listed below, or by using the keyword search tool below to find specific information within the annual report.-
 1
1 -
2
-
3
-
4
-
5
-
6
-
7
-
8
-
9
-
10
-
11
-
12
-
13
-
14
-
15
-
16
-
17
-
18
-
19
-
20
-
21
-
22
-
23
-
24
-
25
-
26
-
27
-
28
-
29
-
30
-
31
-
32
-
33
-
34
-
35
-
36
-
37
-
38
-
39
-
40
-
41
-
42
-
43
-
44
-
45
-
46
-
47
-
48
-
49
-
50
-
51
-
52
-
53
-
54
-
55
-
56
-
57
-
58
-
59
-
60
-
61
-
62
-
63
-
64
-
65
-
66
-
67
-
68
-
69
-
70
-
71
-
72
-
73
-
74
-
75
-
76
-
77
-
78
-
79
-
80
-
81
-
82
-
83
-
84
-
85
-
86
-
87
-
88
-
89
-
90
-
91
-
92
-
93
-
94
-
95
-
96
-
97
-
98
-
99
-
100
-
101
-
102
-
103
-
104
-
105
-
106
-
107
-
108
-
109
-
110
-
111
-
112
-
113
-
114
-
115
-
116
-
117
-
118
-
119
-
120
-
121
-
122
-
123
-
124
-
125
-
126
-
127
-
128
-
129
-
130
-
131
-
132
-
133
-
134
-
135
-
136
-
137
-
138
-
 139
139 -
 140
140 -
 141
141 -
 142
142 -
 143
143 -
 144
144 -
 145
145 -
 146
146 -
 147
147 -
 148
148 -
 149
149 -
 150
150 -
 151
151 -
 152
152 -
 153
153 -
 154
154 -
 155
155 -
 156
156 -
 157
157 -
 158
158 -
 159
159 -
160
-
161
-
162
-
163
-
164
-
165
-
166
-
167
-
168
-
169
-
170
-
171
-
172
-
173
-
174
-
175
-
176
-
177
-
178
-
179
-
180
-
181
-
182
-
183
-
184
-
185
-
186
-
187
-
188
-
189
-
190
-
191
-
192
-
193
-
194
-
195
-
196
-
197
-
198
-
199
-
200
-
201
-
202
-
203
-
204
-
205
-
206
-
207
-
208
-
209
-
210
-
211
-
212
-
213
-
214
-
215
-
216
-
217
-
218
-
219
-
220
-
221
-
222
-
223
-
224
-
225
-
226
-
227
-
228
-
229
-
230
-
231
-
232
-
233
-
234
-
235
-
236
-
237
-
238
-
239
-
240
-
241
-
242
-
243
-
244
-
245
-
246
-
247
-
248
-
249
-
250
-
251
-
252
-
253
-
254
-
255
-
256
-
257
-
258
-
259
-
260
-
261
-
262
-
263
-
264
-
265
-
266
-
267
-
268
-
269
-
270
-
271
-
272
-
273
-
274
-
275
-
276
 |
 |

149
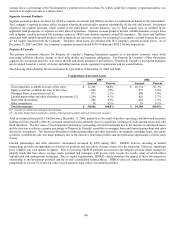
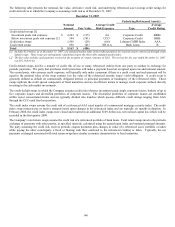
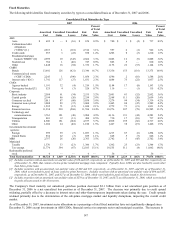
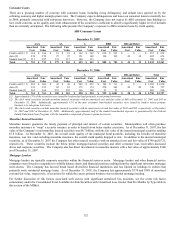
Sub-prime Residential Mortgage Loans
The Company has exposure to sub-prime and Alt-A residential mortgage backed securities included in the Consolidated Fixed
Maturities by Type table above. Sub-prime mortgage lending is the origination of residential mortgage loans to customers with weak
credit profiles. Alt-A mortgage lending is the origination of residential mortgage loans to customers who have credit ratings above sub-
prime but do not conform to government-sponsored enterprise standards. Both of these categories are considered to be below-prime.
The Company is not an originator of below-prime mortgages. The slowing U.S. housing market, greater use of affordability mortgage
products, and relaxed underwriting standards for some originators of below-prime loans has recently led to higher delinquency and loss
rates, especially within the 2007 and 2006 vintage years. These factors have caused a pull-back in market liquidity and repricing of risk,
which has led to an increase in unrealized losses from December 31, 2006 to December 31, 2007. The Company expects delinquency
and loss rates in the sub-prime mortgage sector to continue to increase in the near term. The Company has performed cash flow analysis
on its sub-prime holdings stressing multiple variables, including prepayment speeds, default rates, and loss severity. Based on this
analysis and the Company’s expectation of future loan performance, other than certain credit related impairments recorded in the current
year, future payments are expected to be received in accordance with the contractual terms of the securities. For a discussion on credit
related impairments, see Other-Than-Temporary Impairments section included in the Investment Results section of the MD&A.
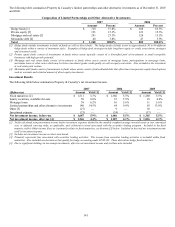
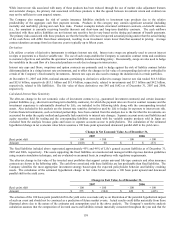
The following table presents the Company’ s exposure to ABS supported by sub-prime mortgage loans by credit quality and vintage
year, including direct investments in CDOs that contain a sub-prime loan component, included in the RMBS and CDO line in the table
above.
Sub-Prime Residential Mortgage Loans [1] [2] [3] [4] [5]
December 31, 2007
AAA AA A BBB
BB and Below Total
Amortized
Cost
Fair
Value
Amortized
Cost
Fair
Value
Amortized
Cost
Fair
Value
Amortized
Cost
Fair
Value
Amortized
Cost
Fair
Value
Amortized
Cost
Fair
Value
2003 & Prior $ 93 $ 92 $ 213 $ 199 $ 113 $ 94 $ 8 $ 7 $ 7 $ 7 $ 434 $ 399
2004 133 131 358 324 2 2 2 1 — — 495 458
2005 113 107 796 713 8 5 10 3 33 23 960 851
2006 457 413 67 55 2 3 3 2 8 2 537 475
2007 280 241 71 39 56 47 21 20 25 27 453 374
Total $ 1,076 $ 984 $ 1,505 $ 1,330 $ 181 $ 151 $ 44 $ 33 $ 73 $ 59 $ 2,879 $ 2,557
Credit
protection [6] 32.7% 47.3% 21.1% 19.6% 17.1% 39.8%
December 31, 2006
AAA AA A BBB
BB and Below Total
Amortized
Cost
Fair
Value
Amortized
Cost
Fair
Value
Amortized
Cost
Fair
Value
Amortized
Cost
Fair
Value
Amortized
Cost
Fair
Value
Amortized
Cost
Fair
Value
2003 & Prior $ 130 $ 131 $ 300 $ 302 $ 211 $ 211 $ 15 $ 15 $ 5 $ 8 $ 661 $ 667
2004 279 279 411 412 3 3 11 11 — — 704 705
2005 171 171 807 810 — — — — 55 49 1,033 1,030
2006 361 361 45 46 4 4 3 3 5 5 418 419
Total $ 941 $ 942 $ 1,563 $ 1,570 $ 218 $ 218 $ 29 $ 29 $ 65 $ 62 $ 2,816 $ 2,821
[1] The vintage year represents the year the underlying loans in the pool were originated.
[2] Securities backed by Alt-A residential mortgages, including CMOs, have an amortized cost and fair value of $366 and $357, respectively, as of
December 31, 2007, and $99 as of December 31, 2006. These amounts are not included in the table.
[3] The Company’s exposure to second lien residential mortgages is composed primarily of loans to prime and Alt-A borrowers, of which
approximately half were wrapped by monoline insurers. These securities are included in the table above and have an amortized cost and fair
value of $260 and $217, respectively, as of December 31, 2007 and $160 and $161, respectively, as of December 31, 2006.
[4] As of December 31, 2007, the weighted average life of the sub-prime residential mortgage portfolio was 3.3 years.
[5] Approximately 80% of the portfolio is backed by adjustable rate mortgages.
[6] Represents the current weighted average percentage, excluding wrapped securities, of the capital structure subordinated to the Company’s
investment holding that is available to absorb losses before the security incurs the first dollar loss of principal.