The Hartford 2007 Annual Report Download - page 34
Download and view the complete annual report
Please find page 34 of the 2007 The Hartford annual report below. You can navigate through the pages in the report by either clicking on the pages listed below, or by using the keyword search tool below to find specific information within the annual report.-
 1
1 -
2
-
3
-
4
-
5
-
6
-
7
-
8
-
9
-
10
-
11
-
12
-
13
-
14
-
15
-
16
-
17
-
18
-
19
-
20
-
21
-
22
-
23
-
 24
24 -
 25
25 -
 26
26 -
 27
27 -
 28
28 -
 29
29 -
 30
30 -
 31
31 -
 32
32 -
 33
33 -
 34
34 -
 35
35 -
 36
36 -
 37
37 -
 38
38 -
 39
39 -
 40
40 -
 41
41 -
 42
42 -
 43
43 -
 44
44 -
45
-
46
-
47
-
48
-
49
-
50
-
51
-
52
-
53
-
54
-
55
-
56
-
57
-
58
-
59
-
60
-
61
-
62
-
63
-
64
-
65
-
66
-
67
-
68
-
69
-
70
-
71
-
72
-
73
-
74
-
75
-
76
-
77
-
78
-
79
-
80
-
81
-
82
-
83
-
84
-
85
-
86
-
87
-
88
-
89
-
90
-
91
-
92
-
93
-
94
-
95
-
96
-
97
-
98
-
99
-
100
-
101
-
102
-
103
-
104
-
105
-
106
-
107
-
108
-
109
-
110
-
111
-
112
-
113
-
114
-
115
-
116
-
117
-
118
-
119
-
120
-
121
-
122
-
123
-
124
-
125
-
126
-
127
-
128
-
129
-
130
-
131
-
132
-
133
-
134
-
135
-
136
-
137
-
138
-
139
-
140
-
141
-
142
-
143
-
144
-
145
-
146
-
147
-
148
-
149
-
150
-
151
-
152
-
153
-
154
-
155
-
156
-
157
-
158
-
159
-
160
-
161
-
162
-
163
-
164
-
165
-
166
-
167
-
168
-
169
-
170
-
171
-
172
-
173
-
174
-
175
-
176
-
177
-
178
-
179
-
180
-
181
-
182
-
183
-
184
-
185
-
186
-
187
-
188
-
189
-
190
-
191
-
192
-
193
-
194
-
195
-
196
-
197
-
198
-
199
-
200
-
201
-
202
-
203
-
204
-
205
-
206
-
207
-
208
-
209
-
210
-
211
-
212
-
213
-
214
-
215
-
216
-
217
-
218
-
219
-
220
-
221
-
222
-
223
-
224
-
225
-
226
-
227
-
228
-
229
-
230
-
231
-
232
-
233
-
234
-
235
-
236
-
237
-
238
-
239
-
240
-
241
-
242
-
243
-
244
-
245
-
246
-
247
-
248
-
249
-
250
-
251
-
252
-
253
-
254
-
255
-
256
-
257
-
258
-
259
-
260
-
261
-
262
-
263
-
264
-
265
-
266
-
267
-
268
-
269
-
270
-
271
-
272
-
273
-
274
-
275
-
276
 |
 |

34
reinsurance projection based on the terms of any applicable facultative and treaty reinsurance, including an estimate of how incurred but
not reported losses will ultimately be ceded by reinsurance agreement. Accordingly, the Company’ s estimate of reinsurance
recoverables is subject to similar risks and uncertainties as the estimate of the gross reserve for unpaid losses and loss adjustment
expenses.
The Company provides an allowance for uncollectible reinsurance, reflecting management’ s best estimate of reinsurance cessions that
may be uncollectible in the future due to reinsurers’ unwillingness or inability to pay. The Company analyzes recent developments in
commutation activity between reinsurers and cedants, recent trends in arbitration and litigation outcomes in disputes between reinsurers
and cedants and the overall credit quality of the Company’ s reinsurers. Where its contracts permit, the Company secures future claim
obligations with various forms of collateral, including irrevocable letters of credit, secured trusts, funds held accounts and group-wide
offsets. The allowance for uncollectible reinsurance was $404 as of December 31, 2007, including $267 related to Other Operations and
$137 related to Ongoing Operations.
Due to the inherent uncertainties as to collection and the length of time before reinsurance recoverables become due, it is possible that
future adjustments to the Company’ s reinsurance recoverables, net of the allowance, could be required, which could have a material
adverse effect on the Company’s consolidated results of operations or cash flows in a particular quarter or annual period.
The Hartford, like other insurance companies, categorizes and tracks its insurance reserves for its segments by “line of business”, such
as property, auto physical damage, auto liability, commercial multi-peril package business, workers’ compensation, general liability
professional liability and fidelity and surety. Furthermore, The Hartford regularly reviews the appropriateness of reserve levels at the
line of business level, taking into consideration the variety of trends that impact the ultimate settlement of claims for the subsets of
claims in each particular line of business. In addition, within the Other Operations segment, the Company has reserves for asbestos and
environmental (“A&E”) claims. Adjustments to previously established reserves, which may be material, are reflected in the operating
results of the period in which the adjustment is determined to be necessary. In the judgment of management, information currently
available has been properly considered in the reserves established for losses and loss adjustment expenses. Incurred but not reported
(“IBNR”) reserves represent the difference between the estimated ultimate cost of all claims and the actual reported loss and loss
adjustment expenses (“reported losses”). Reported losses represent cumulative loss and loss adjustment expenses paid plus case
reserves for outstanding reported claims. Company actuaries evaluate the total reserves (IBNR and case reserves) on an accident year
basis. An accident year is the calendar year in which a loss is incurred, or, in the case of claims-made policies, the calendar year in
which a loss is reported.
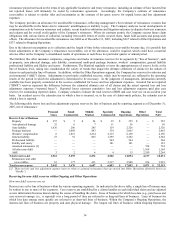
The following table shows loss and loss adjustment expense reserves by line of business and by reporting segment as of December 31,
2007, net of reinsurance:
Personal
Lines
Small
Commercial
Middle
Market
Specialty
Commercial
Ongoing
Operations
Other
Operations
Total
P&C
Reserve Line of Business
Property $ 257 $ 5 $ 54 $ 39 $ 355 $ — $ 355
Auto physical damage 32 6 7 11 56 — 56
Auto liability 1,636 286 285 119 2,326 — 2,326
Package business — 1,088 843 134 2,065 — 2,065
Workers’ compensation 6 1,815 2,214 2,115 6,150 — 6,150
General liability 27 91 865 1,399 2,382 — 2,382
Professional liability — — — 564 564 — 564
Fidelity and surety — — — 181 181 — 181
Assumed reinsurance [1] — — — — — 724 724
All other non-A&E — — — — — 1,164 1,164
A&E 3 2 6 4 15 2,249 2,264
Total reserves-net 1,961 3,293 4,274 4,566 14,094 4,137 18,231
Reinsurance and other
recoverables
81
177
413
2,317
2,988
934
3,922
Total reserves-gross $ 2,042 $ 3,470 $ 4,687 $ 6,883 $ 17,082 $ 5,071 $ 22,153
[1] These net loss and loss adjustment expense reserves relate to assumed reinsurance that was moved into Other Operations (formerly known as
“HartRe”).
Reserving for non-A&E reserves within Ongoing and Other Operations
How non-A&E reserves are set
Reserves are set by line of business within the various reporting segments. As indicated in the above table, a single line of business may
be written in one or more of the segments. Case reserves are established by a claims handler on each individual claim and are adjusted
as new information becomes known during the course of handling the claim. Lines of business for which loss data (e.g., paid losses and
case reserves) emerge (i.e., is reported) over a long period of time are referred to as long-tail lines of business. Lines of business for
which loss data emerge more quickly are referred to as short-tail lines of business. Within the Company’ s Ongoing Operations, the
shortest-tail lines of business are property and auto physical damage. The longest tail lines of business within Ongoing Operations