The Hartford 2007 Annual Report Download - page 100
Download and view the complete annual report
Please find page 100 of the 2007 The Hartford annual report below. You can navigate through the pages in the report by either clicking on the pages listed below, or by using the keyword search tool below to find specific information within the annual report.-
 1
1 -
2
-
3
-
4
-
5
-
6
-
7
-
8
-
9
-
10
-
11
-
12
-
13
-
14
-
15
-
16
-
17
-
18
-
19
-
20
-
21
-
22
-
23
-
24
-
25
-
26
-
27
-
28
-
29
-
30
-
31
-
32
-
33
-
34
-
35
-
36
-
37
-
38
-
39
-
40
-
41
-
42
-
43
-
44
-
45
-
46
-
47
-
48
-
49
-
50
-
51
-
52
-
53
-
54
-
55
-
56
-
57
-
58
-
59
-
60
-
61
-
62
-
63
-
64
-
65
-
66
-
67
-
68
-
69
-
70
-
71
-
72
-
73
-
74
-
75
-
76
-
77
-
78
-
79
-
80
-
81
-
82
-
83
-
84
-
85
-
86
-
87
-
88
-
89
-
 90
90 -
 91
91 -
 92
92 -
 93
93 -
 94
94 -
 95
95 -
 96
96 -
 97
97 -
 98
98 -
 99
99 -
 100
100 -
 101
101 -
 102
102 -
 103
103 -
 104
104 -
 105
105 -
 106
106 -
 107
107 -
 108
108 -
 109
109 -
 110
110 -
111
-
112
-
113
-
114
-
115
-
116
-
117
-
118
-
119
-
120
-
121
-
122
-
123
-
124
-
125
-
126
-
127
-
128
-
129
-
130
-
131
-
132
-
133
-
134
-
135
-
136
-
137
-
138
-
139
-
140
-
141
-
142
-
143
-
144
-
145
-
146
-
147
-
148
-
149
-
150
-
151
-
152
-
153
-
154
-
155
-
156
-
157
-
158
-
159
-
160
-
161
-
162
-
163
-
164
-
165
-
166
-
167
-
168
-
169
-
170
-
171
-
172
-
173
-
174
-
175
-
176
-
177
-
178
-
179
-
180
-
181
-
182
-
183
-
184
-
185
-
186
-
187
-
188
-
189
-
190
-
191
-
192
-
193
-
194
-
195
-
196
-
197
-
198
-
199
-
200
-
201
-
202
-
203
-
204
-
205
-
206
-
207
-
208
-
209
-
210
-
211
-
212
-
213
-
214
-
215
-
216
-
217
-
218
-
219
-
220
-
221
-
222
-
223
-
224
-
225
-
226
-
227
-
228
-
229
-
230
-
231
-
232
-
233
-
234
-
235
-
236
-
237
-
238
-
239
-
240
-
241
-
242
-
243
-
244
-
245
-
246
-
247
-
248
-
249
-
250
-
251
-
252
-
253
-
254
-
255
-
256
-
257
-
258
-
259
-
260
-
261
-
262
-
263
-
264
-
265
-
266
-
267
-
268
-
269
-
270
-
271
-
272
-
273
-
274
-
275
-
276
 |
 |

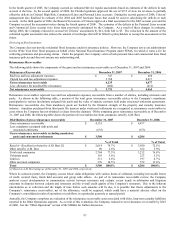
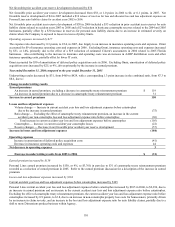
100
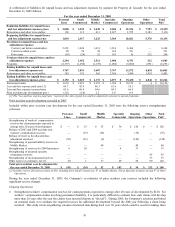
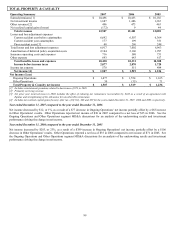
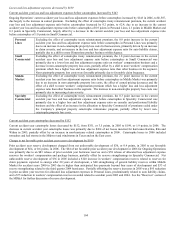
ONGOING OPERATIONS
Ongoing Operations includes the four underwriting segments of Personal Lines, Small Commercial, Middle Market and Specialty
Commercial.
Operating Summary
Net income for Ongoing Operations includes underwriting results for each of its segments, income from servicing businesses, net
investment income, other expenses and net realized capital gains (losses), net of related income taxes.
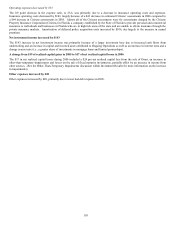
Ongoing Operations 2007 2006 2005
Written premiums $ 10,435 $ 10,658 $ 10,483
Change in unearned premium reserve (56) 230 331
Earned premiums 10,491 10,428 10,152
Losses and loss adjustment expenses
Current accident year before catastrophes 6,692 6,507 6,364
Current accident year catastrophes 177 199 351
Prior accident years (145) (64) 36
Total losses and loss adjustment expenses 6,724 6,642 6,751
Amortization of deferred policy acquisition costs 2,104 2,106 2,000
Insurance operating costs and expenses 694 569 710
Underwriting results 969 1,111 691
Net servicing income [1] 52 53 49
Net investment income 1,439 1,225 1,082
Net realized capital gains (losses) (160) (17) 19
Other expenses (248) (222) (202)
Income before income taxes 2,052 2,150 1,639
Income tax expense (575) (596) (474)
Net income $1,477 $1,554 $1,165
Loss and loss adjustment expense ratio
Current accident year before catastrophes 63.8 62.4 62.7
Current accident year catastrophes 1.7 1.9 3.5
Prior accident years (1.4) (0.6) 0.4
Total loss and loss adjustment expense ratio 64.1 63.7 66.5
Expense ratio 26.3 25.6 26.5
Policyholder dividend ratio 0.4 0.1 0.1
Combined ratio 90.8 89.3 93.2
Catastrophe ratio
Current accident year 1.7 1.9 3.5
Prior accident years 0.1 (0.7) 0.1
Total catastrophe ratio 1.8 1.2 3.6
Combined ratio before catastrophes 89.0 88.1 89.6
Combined ratio before catastrophes and prior accident year development 90.5 88.0 89.4
[1] Net of expenses related to service business.