The Hartford 2007 Annual Report Download - page 136
Download and view the complete annual report
Please find page 136 of the 2007 The Hartford annual report below. You can navigate through the pages in the report by either clicking on the pages listed below, or by using the keyword search tool below to find specific information within the annual report.-
 1
1 -
2
-
3
-
4
-
5
-
6
-
7
-
8
-
9
-
10
-
11
-
12
-
13
-
14
-
15
-
16
-
17
-
18
-
19
-
20
-
21
-
22
-
23
-
24
-
25
-
26
-
27
-
28
-
29
-
30
-
31
-
32
-
33
-
34
-
35
-
36
-
37
-
38
-
39
-
40
-
41
-
42
-
43
-
44
-
45
-
46
-
47
-
48
-
49
-
50
-
51
-
52
-
53
-
54
-
55
-
56
-
57
-
58
-
59
-
60
-
61
-
62
-
63
-
64
-
65
-
66
-
67
-
68
-
69
-
70
-
71
-
72
-
73
-
74
-
75
-
76
-
77
-
78
-
79
-
80
-
81
-
82
-
83
-
84
-
85
-
86
-
87
-
88
-
89
-
90
-
91
-
92
-
93
-
94
-
95
-
96
-
97
-
98
-
99
-
100
-
101
-
102
-
103
-
104
-
105
-
106
-
107
-
108
-
109
-
110
-
111
-
112
-
113
-
114
-
115
-
116
-
117
-
118
-
119
-
120
-
121
-
122
-
123
-
124
-
125
-
 126
126 -
 127
127 -
 128
128 -
 129
129 -
 130
130 -
 131
131 -
 132
132 -
 133
133 -
 134
134 -
 135
135 -
 136
136 -
 137
137 -
 138
138 -
 139
139 -
 140
140 -
 141
141 -
 142
142 -
 143
143 -
 144
144 -
 145
145 -
 146
146 -
147
-
148
-
149
-
150
-
151
-
152
-
153
-
154
-
155
-
156
-
157
-
158
-
159
-
160
-
161
-
162
-
163
-
164
-
165
-
166
-
167
-
168
-
169
-
170
-
171
-
172
-
173
-
174
-
175
-
176
-
177
-
178
-
179
-
180
-
181
-
182
-
183
-
184
-
185
-
186
-
187
-
188
-
189
-
190
-
191
-
192
-
193
-
194
-
195
-
196
-
197
-
198
-
199
-
200
-
201
-
202
-
203
-
204
-
205
-
206
-
207
-
208
-
209
-
210
-
211
-
212
-
213
-
214
-
215
-
216
-
217
-
218
-
219
-
220
-
221
-
222
-
223
-
224
-
225
-
226
-
227
-
228
-
229
-
230
-
231
-
232
-
233
-
234
-
235
-
236
-
237
-
238
-
239
-
240
-
241
-
242
-
243
-
244
-
245
-
246
-
247
-
248
-
249
-
250
-
251
-
252
-
253
-
254
-
255
-
256
-
257
-
258
-
259
-
260
-
261
-
262
-
263
-
264
-
265
-
266
-
267
-
268
-
269
-
270
-
271
-
272
-
273
-
274
-
275
-
276
 |
 |

136
INVESTMENTS
General
The Hartford’s investment portfolios are primarily divided between Life and Property & Casualty. The investment portfolios of Life
and Property & Casualty are managed by Hartford Investment Management Company (“HIMCO”), a wholly-owned subsidiary of The
Hartford. HIMCO manages the portfolios to maximize economic value, while attempting to generate the income necessary to support
the Company’ s various product obligations, within internally established objectives, guidelines and risk tolerances. The portfolio
objectives and guidelines are developed based upon the asset/liability profile, including duration, convexity and other characteristics
within specified risk tolerances. The risk tolerances considered include, for example, asset and credit issuer allocation limits, maximum
portfolio below investment grade (“BIG”) holdings and foreign currency exposure. The Company attempts to minimize adverse
impacts to the portfolio and the Company’ s results of operations due to changes in economic conditions through asset allocation limits,
asset/liability duration matching and through the use of derivatives. For a further discussion of how the investment portfolio’ s credit
and market risks are assessed and managed, see the Investment Credit Risk and Capital Markets Risk Management sections of the
MD&A.
HIMCO’ s security selection process is a multi-dimensional approach that combines independent internal credit research along with a
macro-economic outlook of technical trends (e.g., interest rates, slope of the yield curve and credit spreads) and market pricing to
identify valuation inefficiencies and relative value buying and selling opportunities. Security selection and monitoring are performed by
asset class specialists working within dedicated portfolio management teams.
HIMCO portfolio managers may sell securities (except those securities in an unrealized loss position for which the Company has
indicated its intent and ability to hold until the price recovers) due to portfolio guidelines or market technicals or trends. For example,
the Company may sell securities to manage risk, capture market valuation inefficiencies or relative value opportunities, to remain
compliant with internal asset/liability duration matching guidelines, or to modify a portfolio’ s duration to capitalize on interest rate
levels or the yield curve slope.
HIMCO believes that advantageously buying and selling securities within a disciplined framework, provides the greatest economic
value for the Company over the long-term.
Return on general account invested assets is an important element of The Hartford’ s financial results. Significant fluctuations in the
fixed income or equity markets could weaken the Company’ s financial condition or its results of operations. Additionally, changes in
market interest rates may impact the period of time over which certain investments, such as MBS, are repaid and whether certain
investments are called by the issuers. Such changes may, in turn, impact the yield on these investments and also may result in re-
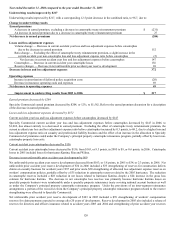
investment of funds received from calls and prepayments at rates below the average portfolio yield. Net investment income and net
realized capital gains (losses) accounted for approximately 17%, 24% and 30% of the Company’ s consolidated revenues for the years
ended December 31, 2007, 2006 and 2005, respectively. Net investment income, excluding net investment income from trading
securities, and net realized capital gains and losses accounted for approximately 16%, 18% and 19%, for the years ended December 31,
2007, 2006 and 2005, respectively. The decrease in the percentage of consolidated revenues for 2007, as compared to the prior years, is
primarily due to a smaller increase in the value of equity securities held for trading and an increase in realized capital losses.
Fluctuations in interest rates affect the Company’ s return on, and the fair value of, fixed maturity investments, which comprised
approximately 61% and 66% of the fair value of its invested assets as of December 31, 2007 and 2006, respectively. Other events
beyond the Company’ s control, including changes in credit spreads, could also adversely impact the fair value of these investments.
Additionally, a downgrade of an issuer’ s credit rating or default of payment by an issuer could reduce the Company’ s investment return.
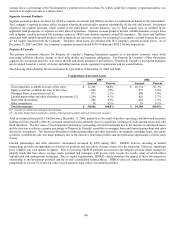
The Company invests in private placement securities, mortgage loans and limited partnerships and other alternative investments in order
to further diversify its investment portfolio. These investment types comprised approximately 23% and 21% of the fair value of its
invested assets as of December 31, 2007 and 2006, respectively. These security types are typically less liquid than direct investments in
publicly traded fixed income or equity investments. However, generally these securities have higher yields to compensate for the
liquidity risk.
A decrease in the fair value of any investment that is deemed other-than-temporary would result in the Company’ s recognition of a net
realized capital loss in its financial results prior to the actual sale of the investment. Following the recognition of the other-than-
temporary impairment for fixed maturities, the Company accretes the new cost basis to par or to estimated future value over the
remaining life of the security based on future estimated cash flows by adjusting the security’ s yields. For a further discussion of the
evaluation of other-than-temporary impairments, see the Critical Accounting Estimates section of the MD&A under “Evaluation of
Other-Than-Temporary Impairments on Available-for-Sale Securities”.