The Hartford 2007 Annual Report Download - page 137
Download and view the complete annual report
Please find page 137 of the 2007 The Hartford annual report below. You can navigate through the pages in the report by either clicking on the pages listed below, or by using the keyword search tool below to find specific information within the annual report.-
 1
1 -
2
-
3
-
4
-
5
-
6
-
7
-
8
-
9
-
10
-
11
-
12
-
13
-
14
-
15
-
16
-
17
-
18
-
19
-
20
-
21
-
22
-
23
-
24
-
25
-
26
-
27
-
28
-
29
-
30
-
31
-
32
-
33
-
34
-
35
-
36
-
37
-
38
-
39
-
40
-
41
-
42
-
43
-
44
-
45
-
46
-
47
-
48
-
49
-
50
-
51
-
52
-
53
-
54
-
55
-
56
-
57
-
58
-
59
-
60
-
61
-
62
-
63
-
64
-
65
-
66
-
67
-
68
-
69
-
70
-
71
-
72
-
73
-
74
-
75
-
76
-
77
-
78
-
79
-
80
-
81
-
82
-
83
-
84
-
85
-
86
-
87
-
88
-
89
-
90
-
91
-
92
-
93
-
94
-
95
-
96
-
97
-
98
-
99
-
100
-
101
-
102
-
103
-
104
-
105
-
106
-
107
-
108
-
109
-
110
-
111
-
112
-
113
-
114
-
115
-
116
-
117
-
118
-
119
-
120
-
121
-
122
-
123
-
124
-
125
-
126
-
 127
127 -
 128
128 -
 129
129 -
 130
130 -
 131
131 -
 132
132 -
 133
133 -
 134
134 -
 135
135 -
 136
136 -
 137
137 -
 138
138 -
 139
139 -
 140
140 -
 141
141 -
 142
142 -
 143
143 -
 144
144 -
 145
145 -
 146
146 -
 147
147 -
148
-
149
-
150
-
151
-
152
-
153
-
154
-
155
-
156
-
157
-
158
-
159
-
160
-
161
-
162
-
163
-
164
-
165
-
166
-
167
-
168
-
169
-
170
-
171
-
172
-
173
-
174
-
175
-
176
-
177
-
178
-
179
-
180
-
181
-
182
-
183
-
184
-
185
-
186
-
187
-
188
-
189
-
190
-
191
-
192
-
193
-
194
-
195
-
196
-
197
-
198
-
199
-
200
-
201
-
202
-
203
-
204
-
205
-
206
-
207
-
208
-
209
-
210
-
211
-
212
-
213
-
214
-
215
-
216
-
217
-
218
-
219
-
220
-
221
-
222
-
223
-
224
-
225
-
226
-
227
-
228
-
229
-
230
-
231
-
232
-
233
-
234
-
235
-
236
-
237
-
238
-
239
-
240
-
241
-
242
-
243
-
244
-
245
-
246
-
247
-
248
-
249
-
250
-
251
-
252
-
253
-
254
-
255
-
256
-
257
-
258
-
259
-
260
-
261
-
262
-
263
-
264
-
265
-
266
-
267
-
268
-
269
-
270
-
271
-
272
-
273
-
274
-
275
-
276
 |
 |

137
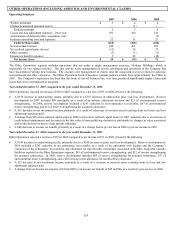
Life
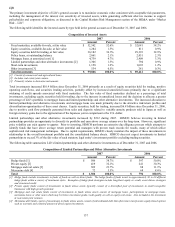
The primary investment objective of Life’s general account is to maximize economic value consistent with acceptable risk parameters,
including the management of the interest rate sensitivity of invested assets, while generating sufficient after-tax income to support
policyholder and corporate obligations, as discussed in the Capital Markets Risk Management section of the MD&A under “Market
Risk – Life”.
The following table identifies the invested assets by type held in the general account as of December 31, 2007 and 2006.
Composition of Invested Assets
2007 2006
Amount Percent
Amount Percent
Fixed maturities, available-for-sale, at fair value $ 52,542 52.6% $ 52,081 58.2%
Equity securities, available-for-sale, at fair value 1,284 1.3% 811 0.9%
Equity securities held for trading, at fair value 36,182 36.3% 29,393 32.9%
Policy loans, at outstanding balance 2,061 2.1% 2,051 2.3%
Mortgage loans, at amortized cost [1] 4,739 4.7% 2,909 3.3%
Limited partnerships and other alternative investments [2] 1,306 1.3% 794 0.9%
Short-term investments 1,158 1.2% 1,092 1.2%
Other investments [3] 534 0.5% 281 0.3%
Total investments $ 99,806 100.0% $ 89,412 100.0%
[1] Consist of commercial and agricultural loans.
[2] Includes real estate joint venture.
[3] Primarily relates to derivative instruments.
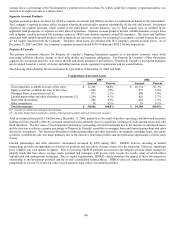
Total investments increased $10.4 billion since December 31, 2006 primarily as a result of equity securities held for trading, positive
operating cash flows, and securities lending activities, partially offset by increased unrealized losses primarily due to a significant
widening of credit spreads associated with fixed maturities. The fair value of fixed maturities declined as a percentage of total
investments, excluding equity securities held for trading, due to the increase in unrealized losses and the decision to allocate a greater
percentage of Life’ s portfolio to mortgage loans and limited partnerships and other alternative investments. The increased allocation to
limited partnerships and alternative investments and mortgage loans was made primarily due to the attractive risk/return profiles and
diversification opportunities of these asset classes. Equity securities, held for trading, increased $6.8 billion since December 31, 2006,
due to positive cash flow primarily generated from sales and deposits related to variable annuity products sold in Japan as well as
foreign currency gains due to the appreciation of the Japanese yen in comparison to the U.S. dollar.
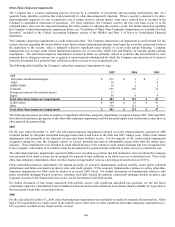
Limited partnerships and other alternative investments increased by $512 during 2007. HIMCO believes investing in limited
partnerships provides an opportunity to diversify its portfolio and earn above average returns over the long-term. However, significant
price volatility can exist quarter to quarter. Prior to investing, HIMCO performs an extensive due diligence process which attempts to
identify funds that have above average return potential and managers with proven track records for results, many of which utilize
sophisticated risk management techniques. Due to capital requirements, HIMCO closely monitors the impact of these investments in
relationship to the overall investment portfolio and the consolidated balance sheets. HIMCO does not expect investments in limited
partnerships to exceed 3% of the fair value of each statutory legal entity’ s investment portfolio excluding trading securities.
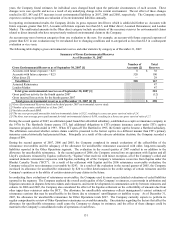
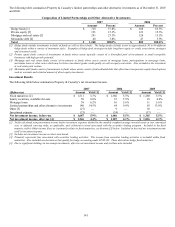
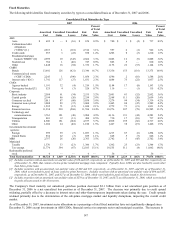
The following table summarizes Life’ s limited partnerships and other alternative investments as of December 31, 2007 and 2006.
Composition of Limited Partnerships and Other Alternative Investments
2007 2006
Amount Percent
Amount Percent
Hedge funds [1] $ 506 38.7% $ 397 50.0%
Private equity [2] 419 32.1% 241 30.3%
Mortgage and real estate [3] 309 23.7% 88 11.1%
Mezzanine debt [4] 72 5.5% 68 8.6%
Total $ 1,306 100.0% $ 794 100.0%
[1] Hedge funds include investments in funds of funds as well as direct funds. The hedge funds of funds invest in approximately 30 to 60 different
hedge funds within a variety of investment styles. Examples of hedge fund strategies include long/short equity or credit, event driven strategies
and structured credit.
[2] Private equity funds consist of investments in funds whose assets typically consist of a diversified pool of investments in small non-public
businesses with high growth potential.
[3] Mortgage and real estate funds consist of investments in funds whose assets consist of mortgage loans, participations in mortgage loans,
mezzanine loans or other notes which may be below investment grade credit quality as well as equity real estate. Also included is the investment
in real estate joint ventures.
[4] Mezzanine debt funds consist of investments in funds whose assets consist of subordinated debt that often times incorporates equity-based options
such as warrants and a limited amount of direct equity investments.