The Hartford 2007 Annual Report Download - page 124
Download and view the complete annual report
Please find page 124 of the 2007 The Hartford annual report below. You can navigate through the pages in the report by either clicking on the pages listed below, or by using the keyword search tool below to find specific information within the annual report.-
 1
1 -
2
-
3
-
4
-
5
-
6
-
7
-
8
-
9
-
10
-
11
-
12
-
13
-
14
-
15
-
16
-
17
-
18
-
19
-
20
-
21
-
22
-
23
-
24
-
25
-
26
-
27
-
28
-
29
-
30
-
31
-
32
-
33
-
34
-
35
-
36
-
37
-
38
-
39
-
40
-
41
-
42
-
43
-
44
-
45
-
46
-
47
-
48
-
49
-
50
-
51
-
52
-
53
-
54
-
55
-
56
-
57
-
58
-
59
-
60
-
61
-
62
-
63
-
64
-
65
-
66
-
67
-
68
-
69
-
70
-
71
-
72
-
73
-
74
-
75
-
76
-
77
-
78
-
79
-
80
-
81
-
82
-
83
-
84
-
85
-
86
-
87
-
88
-
89
-
90
-
91
-
92
-
93
-
94
-
95
-
96
-
97
-
98
-
99
-
100
-
101
-
102
-
103
-
104
-
105
-
106
-
107
-
108
-
109
-
110
-
111
-
112
-
113
-
 114
114 -
 115
115 -
 116
116 -
 117
117 -
 118
118 -
 119
119 -
 120
120 -
 121
121 -
 122
122 -
 123
123 -
 124
124 -
 125
125 -
 126
126 -
 127
127 -
 128
128 -
 129
129 -
 130
130 -
 131
131 -
 132
132 -
 133
133 -
 134
134 -
135
-
136
-
137
-
138
-
139
-
140
-
141
-
142
-
143
-
144
-
145
-
146
-
147
-
148
-
149
-
150
-
151
-
152
-
153
-
154
-
155
-
156
-
157
-
158
-
159
-
160
-
161
-
162
-
163
-
164
-
165
-
166
-
167
-
168
-
169
-
170
-
171
-
172
-
173
-
174
-
175
-
176
-
177
-
178
-
179
-
180
-
181
-
182
-
183
-
184
-
185
-
186
-
187
-
188
-
189
-
190
-
191
-
192
-
193
-
194
-
195
-
196
-
197
-
198
-
199
-
200
-
201
-
202
-
203
-
204
-
205
-
206
-
207
-
208
-
209
-
210
-
211
-
212
-
213
-
214
-
215
-
216
-
217
-
218
-
219
-
220
-
221
-
222
-
223
-
224
-
225
-
226
-
227
-
228
-
229
-
230
-
231
-
232
-
233
-
234
-
235
-
236
-
237
-
238
-
239
-
240
-
241
-
242
-
243
-
244
-
245
-
246
-
247
-
248
-
249
-
250
-
251
-
252
-
253
-
254
-
255
-
256
-
257
-
258
-
259
-
260
-
261
-
262
-
263
-
264
-
265
-
266
-
267
-
268
-
269
-
270
-
271
-
272
-
273
-
274
-
275
-
276
 |
 |

124
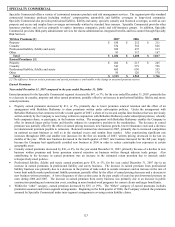
Year ended December 31, 2006 compared to the year ended December 31, 2005
Earned premiums for the Specialty Commercial segment decreased by $204, or 12%, primarily due to decreases in casualty, property
and other earned premiums, partially offset by an increase in professional liability, fidelity and surety earned premiums and the effect of
$26 of catastrophe treaty reinstatement premium payable to reinsurers recorded as a reduction of earned premium in 2005.
• Property earned premium decreased by $32, or 13%, primarily due to a decrease in new business and renewals in the latter half of
2005 and the full year of 2006 as well as the effect of an increase in reinsurance costs for 2006 treaties and additional catastrophe
reinsurance purchased in the fourth quarter of 2005. Partially offsetting the decrease in earned premiums was the non-recurrence of
$34 of catastrophe treaty reinstatement premiums payable to reinsurers recorded as a reduction of earned premium in 2005 and
double digit earned pricing increases during 2006. The reduction in new business and renewals reflects a decision to reduce
catastrophe loss exposures in certain geographic areas and a determination that, despite rate increases, rates on some business
opportunities were not adequate. Property business has experienced significant rate increases throughout 2006, reflecting a
hardening of the market after the 2005 hurricanes.
• Casualty earned premiums decreased by $217, or 27%, primarily because of the non-renewal of a single captive insurance program
and a decline in new business written premium growth. Partially offsetting the decrease was an increase in premium retention and
the effect of renewing a single large deductible policy as a retrospectively rated policy which bears a higher premium. The single
captive insurance program accounted for earned premium of $241 for the year ended December 31, 2005.
• Professional liability, fidelity and surety earned premium grew $95, or 17%, due primarily to a decrease in the portion of risks
ceded to outside reinsurers, new business growth in commercial and contract surety business, earned pricing increases in contract
surety business and new business growth in middle market and small commercial professional liability business, partially offset by
earned pricing decreases in professional liability. The growth in commercial and contract surety was primarily driven by an
increase in the number of fidelity and surety bonds issued to existing accounts.
• Within the “other” category, earned premium decreased by $50, or 29%. The “other” category of earned premiums includes
premiums assumed and ceded under inter-segment arrangements and co-participations. Under an inter-segment arrangement,
beginning in the first quarter of 2006, the Company allocated more of the premiums ceded under the principal property catastrophe
reinsurance program to Specialty Commercial and less to Personal Lines, Small Commercial and Middle Market. In addition,
beginning in the third quarter of 2006, the Company reduced the premiums assumed by Specialty Commercial under inter-segment
arrangements covering certain liability claims.
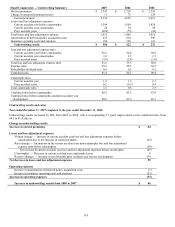
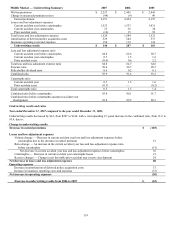
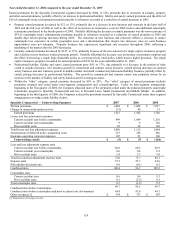
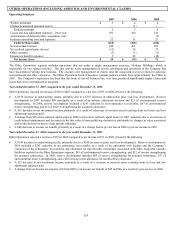
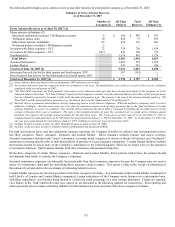
Specialty Commercial — Underwriting Summary 2007 2006 2005
Written premiums $ 1,484 $ 1,608 $ 1,817
Change in unearned premium reserve (31) 46 51
Earned premiums 1,515 1,562 1,766
Losses and loss adjustment expenses
Current accident year before catastrophes 999 1,069 1,216
Current accident year catastrophes 9 9 165
Prior accident years 82 34 103
Total losses and loss adjustment expenses 1,090 1,112 1,484
Amortization of deferred policy acquisition costs 323 306 286
Insurance operating costs and expenses 107 91 160
Underwriting results $ (5) $ 53 $ (164)
Loss and loss adjustment expense ratio
Current accident year before catastrophes 66.0 68.2 68.9
Current accident year catastrophes 0.6 0.6 9.3
Prior accident years 5.4 2.3 5.8
Total loss and loss adjustment expense ratio 72.0 71.1 84.1
Expense ratio 27.5 25.7 24.6
Policyholder dividend ratio 0.9 (0.1) 0.5
Combined ratio 100.4 96.7 109.2
Catastrophe ratio
Current accident year 0.6 0.6 9.3
Prior accident years 0.1 (2.5) 0.1
Total catastrophe ratio 0.7 (1.9) 9.5
Combined ratio before catastrophes 99.7 98.5 99.7
Combined ratio before catastrophes and prior accident year development 94.4 93.8 94.1
Other revenues [1] $ 354 $ 337 $ 343
[1] Represents servicing revenue