The Hartford 2007 Annual Report Download - page 194
Download and view the complete annual report
Please find page 194 of the 2007 The Hartford annual report below. You can navigate through the pages in the report by either clicking on the pages listed below, or by using the keyword search tool below to find specific information within the annual report.-
 1
1 -
2
-
3
-
4
-
5
-
6
-
7
-
8
-
9
-
10
-
11
-
12
-
13
-
14
-
15
-
16
-
17
-
18
-
19
-
20
-
21
-
22
-
23
-
24
-
25
-
26
-
27
-
28
-
29
-
30
-
31
-
32
-
33
-
34
-
35
-
36
-
37
-
38
-
39
-
40
-
41
-
42
-
43
-
44
-
45
-
46
-
47
-
48
-
49
-
50
-
51
-
52
-
53
-
54
-
55
-
56
-
57
-
58
-
59
-
60
-
61
-
62
-
63
-
64
-
65
-
66
-
67
-
68
-
69
-
70
-
71
-
72
-
73
-
74
-
75
-
76
-
77
-
78
-
79
-
80
-
81
-
82
-
83
-
84
-
85
-
86
-
87
-
88
-
89
-
90
-
91
-
92
-
93
-
94
-
95
-
96
-
97
-
98
-
99
-
100
-
101
-
102
-
103
-
104
-
105
-
106
-
107
-
108
-
109
-
110
-
111
-
112
-
113
-
114
-
115
-
116
-
117
-
118
-
119
-
120
-
121
-
122
-
123
-
124
-
125
-
126
-
127
-
128
-
129
-
130
-
131
-
132
-
133
-
134
-
135
-
136
-
137
-
138
-
139
-
140
-
141
-
142
-
143
-
144
-
145
-
146
-
147
-
148
-
149
-
150
-
151
-
152
-
153
-
154
-
155
-
156
-
157
-
158
-
159
-
160
-
161
-
162
-
163
-
164
-
165
-
166
-
167
-
168
-
169
-
170
-
171
-
172
-
173
-
174
-
175
-
176
-
177
-
178
-
179
-
180
-
181
-
182
-
183
-
 184
184 -
 185
185 -
 186
186 -
 187
187 -
 188
188 -
 189
189 -
 190
190 -
 191
191 -
 192
192 -
 193
193 -
 194
194 -
 195
195 -
 196
196 -
 197
197 -
 198
198 -
 199
199 -
 200
200 -
 201
201 -
 202
202 -
 203
203 -
 204
204 -
205
-
206
-
207
-
208
-
209
-
210
-
211
-
212
-
213
-
214
-
215
-
216
-
217
-
218
-
219
-
220
-
221
-
222
-
223
-
224
-
225
-
226
-
227
-
228
-
229
-
230
-
231
-
232
-
233
-
234
-
235
-
236
-
237
-
238
-
239
-
240
-
241
-
242
-
243
-
244
-
245
-
246
-
247
-
248
-
249
-
250
-
251
-
252
-
253
-
254
-
255
-
256
-
257
-
258
-
259
-
260
-
261
-
262
-
263
-
264
-
265
-
266
-
267
-
268
-
269
-
270
-
271
-
272
-
273
-
274
-
275
-
276
 |
 |
THE HARTFORD FINANCIAL SERVICES GROUP, INC.
NOTES TO CONSOLIDATED FINANCIAL STATEMENTS (continued)
F-17
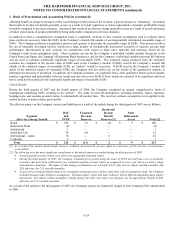
1. Basis of Presentation and Accounting Policies (continued)
Accounting Policies
Investments
The Hartford’ s investments in fixed maturities, which include bonds, redeemable preferred stock and commercial paper; and certain
equity securities, which include common and non-redeemable preferred stocks, are classified as “available-for-sale” and accordingly,
are carried at fair value with the after-tax difference from cost or amortized cost, as adjusted for the effect of deducting the life and
pension policyholders’ share of the immediate participation guaranteed contracts; and certain life and annuity deferred policy
acquisition costs and reserve adjustments, reflected in stockholders’ equity as a component of accumulated other comprehensive
income (“AOCI”). The equity investments associated with the variable annuity products offered in Japan are recorded at fair value and
are classified as “trading” with changes in fair value recorded in net investment income. Policy loans are carried at outstanding
balance, which approximates fair value. Mortgage loans on real estate are recorded at the outstanding principal balance adjusted for
amortization of premiums or discounts and net of valuation allowances, if any. Short-term investments are carried at amortized cost,
which approximates fair value. Other investments primarily consist of limited partnership and other alternative investments and
derivatives instruments. Limited partnerships are accounted for under the equity method and accordingly the Company’s share of
earnings are included in net investment income. Derivatives instruments are carried at fair value.
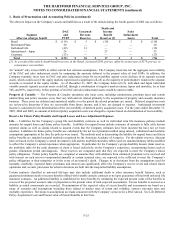
Valuation of Fixed Maturities
The fair value for fixed maturity securities is largely determined by one of three primary pricing methods: third party pricing service
market prices, independent broker quotations or pricing matrices. Security pricing is applied using a hierarchy or “waterfall” approach
whereby prices are first sought from third party pricing services with the remaining unpriced securities submitted to independent
brokers for prices or lastly priced via a pricing matrix. Typical inputs used by these three pricing methods include, but are not limited
to, reported trades, benchmark yields, issuer spreads, bids, offers, and/or estimated cash flows and prepayments speeds. Based on the
typical trading volumes and the lack of quoted market prices for fixed maturities, third party pricing services will normally derive the
security prices through recent reported trades for identical or similar securities making adjustments through the reporting date based
upon available market observable information as outlined above. If there are no recent reported trades, the third party pricing services
and brokers may use matrix or model processes to develop a security price where future cash flow expectations are developed based
upon collateral performance and discounted at an estimated market rate. Included in the asset-backed securities (“ABS”), collaterized
mortgage obligations (“CMOs”), and mortgage-backed securities (“MBS”) pricing are estimates of the rate of future prepayments of
principal over the remaining life of the securities. Such estimates are derived based on the characteristics of the underlying structure
and prepayment speeds previously experienced at the interest rate levels projected for the underlying collateral. Actual prepayment
experience may vary from these estimates.
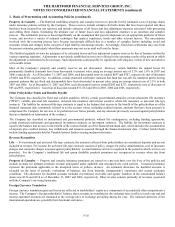
Prices from third party pricing services are often unavailable for securities that are rarely traded or are traded only in privately
negotiated transactions. As a result, certain of the Company’ s securities are priced via independent broker quotations which utilize
inputs that may be difficult to corroborate with observable market based data. A pricing matrix is used to price securities for which the
Company is unable to obtain either a price from a third party pricing service or an independent broker quotation. The pricing matrix
begins with current spread levels to determine the market price for the security. The credit spreads, as assigned by a nationally
recognized rating agency, incorporate the issuer’ s credit rating and a risk premium, if warranted, due to the issuer’ s industry and the
security’ s time to maturity. The issuer-specific yield adjustments, which can be positive or negative, are updated twice annually, as of
June 30 and December 31, by an independent third party source and are intended to adjust security prices for issuer-specific factors.
The matrix-priced securities at December 31, 2007 and 2006 primarily consisted of non-144A private placements and have an average
duration of 4.7 and 5.1 years, respectively. The Company assigns a credit rating to these securities based upon an internal analysis of
the issuer’ s financial strength.
The Company performs a monthly analysis on the prices received from third parties to assess if the prices represent a reasonable
estimate of the fair value. This process involves quantitative and qualitative analysis and is overseen by investment and accounting
professionals. Examples of procedures performed include, but are not limited to, initial and on-going review of third party pricing
services methodologies, review of pricing statistics and trends, back testing recent trades, and monitoring of trading volumes. As a
result of this analysis, if the Company determines there is a more appropriate fair value based upon available market data, the price
received from the third party is adjusted accordingly.