The Hartford 2007 Annual Report Download - page 118
Download and view the complete annual report
Please find page 118 of the 2007 The Hartford annual report below. You can navigate through the pages in the report by either clicking on the pages listed below, or by using the keyword search tool below to find specific information within the annual report.-
 1
1 -
2
-
3
-
4
-
5
-
6
-
7
-
8
-
9
-
10
-
11
-
12
-
13
-
14
-
15
-
16
-
17
-
18
-
19
-
20
-
21
-
22
-
23
-
24
-
25
-
26
-
27
-
28
-
29
-
30
-
31
-
32
-
33
-
34
-
35
-
36
-
37
-
38
-
39
-
40
-
41
-
42
-
43
-
44
-
45
-
46
-
47
-
48
-
49
-
50
-
51
-
52
-
53
-
54
-
55
-
56
-
57
-
58
-
59
-
60
-
61
-
62
-
63
-
64
-
65
-
66
-
67
-
68
-
69
-
70
-
71
-
72
-
73
-
74
-
75
-
76
-
77
-
78
-
79
-
80
-
81
-
82
-
83
-
84
-
85
-
86
-
87
-
88
-
89
-
90
-
91
-
92
-
93
-
94
-
95
-
96
-
97
-
98
-
99
-
100
-
101
-
102
-
103
-
104
-
105
-
106
-
107
-
 108
108 -
 109
109 -
 110
110 -
 111
111 -
 112
112 -
 113
113 -
 114
114 -
 115
115 -
 116
116 -
 117
117 -
 118
118 -
 119
119 -
 120
120 -
 121
121 -
 122
122 -
 123
123 -
 124
124 -
 125
125 -
 126
126 -
 127
127 -
 128
128 -
129
-
130
-
131
-
132
-
133
-
134
-
135
-
136
-
137
-
138
-
139
-
140
-
141
-
142
-
143
-
144
-
145
-
146
-
147
-
148
-
149
-
150
-
151
-
152
-
153
-
154
-
155
-
156
-
157
-
158
-
159
-
160
-
161
-
162
-
163
-
164
-
165
-
166
-
167
-
168
-
169
-
170
-
171
-
172
-
173
-
174
-
175
-
176
-
177
-
178
-
179
-
180
-
181
-
182
-
183
-
184
-
185
-
186
-
187
-
188
-
189
-
190
-
191
-
192
-
193
-
194
-
195
-
196
-
197
-
198
-
199
-
200
-
201
-
202
-
203
-
204
-
205
-
206
-
207
-
208
-
209
-
210
-
211
-
212
-
213
-
214
-
215
-
216
-
217
-
218
-
219
-
220
-
221
-
222
-
223
-
224
-
225
-
226
-
227
-
228
-
229
-
230
-
231
-
232
-
233
-
234
-
235
-
236
-
237
-
238
-
239
-
240
-
241
-
242
-
243
-
244
-
245
-
246
-
247
-
248
-
249
-
250
-
251
-
252
-
253
-
254
-
255
-
256
-
257
-
258
-
259
-
260
-
261
-
262
-
263
-
264
-
265
-
266
-
267
-
268
-
269
-
270
-
271
-
272
-
273
-
274
-
275
-
276
 |
 |

118
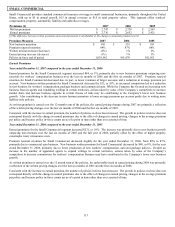
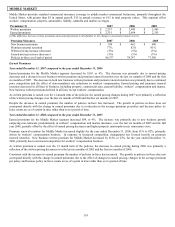
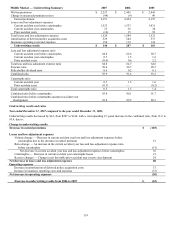
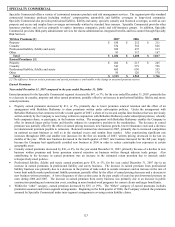
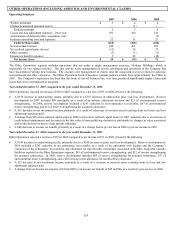
MIDDLE MARKET
Middle Market provides standard commercial insurance coverage to middle market commercial businesses, primarily throughout the
United States, with greater than $5 in annual payroll, $15 in annual revenues or $15 in total property values. This segment offers
workers’ compensation, property, automobile, liability, umbrella and marine coverages.
Premiums [1] 2007 2006 2005
Written premiums $ 2,257 $ 2,445 $ 2,445
Earned premiums $ 2,351 $ 2,454 $ 2,355
[1]The difference between written premiums and earned premiums is attributable to the change in unearned premium reserve.
Premium Measures 2007 2006 2005
New business premium $390 $462 $600
Premium renewal retention 77% 82% 81%
Written pricing increase (decrease) (5%) (5%) (5%)
Earned pricing increase (decrease) (5%) (5%) (3%)
Policies in-force as of end of period 80,377 78,747 77,350
Earned Premiums
Year ended December 31, 2007 compared to the year ended December 31, 2006
Earned premiums for the Middle Market segment decreased by $103, or 4%. The decrease was primarily due to earned pricing
decreases and a decrease in new business written premium and premium renewal retention over the last six months of 2006 and the first
six months of 2007. The decrease in both new business written premium and premium renewal retention was primarily due to continued
price competition and the effect of state-mandated rate reductions in workers' compensation. Earned pricing and premium renewal
retention decreased in all lines of business, including property, commercial auto, general liability, workers’ compensation and marine.
New business written premium declined in all lines except workers’ compensation.
As written premium is earned over the 12-month term of the policies, the earned pricing changes during 2007 were primarily a reflection
of the written pricing changes over the last six months of 2006 and the first six months of 2007.
Despite the decrease in earned premium, the number of policies in-force has increased. The growth in policies in-force does not
correspond directly with the change in earned premiums due to a reduction in the average premium per policy and because policy in-
force counts are as of a point in time rather than over a period of time.
Year ended December 31, 2006 compared to the year ended December 31, 2005
Earned premiums for the Middle Market segment increased $99, or 4%. The increase was primarily due to new business growth
outpacing non-renewals, predominately in workers’ compensation and marine insurance, over the last six months of 2005 and the full
year 2006, partially offset by the effect of earned pricing decreases and higher property catastrophe treaty reinsurance costs.
Premium renewal retention for Middle Market increased slightly for the year ended December 31, 2006, from 81% to 82%, primarily
driven by workers’ compensation business. In response to increased competition, management has focused heavily on premium
renewal retention. New business written premium for Middle Market decreased by $138, or 23%, for the year ended December 31,
2006, primarily due to increased competition for workers’ compensation business.
As written premium is earned over the 12 month term of the policies, the decrease in earned pricing during 2006 was primarily a
reflection of the written pricing decreases over the last six months of 2005 and the first six months of 2006.
Consistent with the increase in earned premium the number of policies in-force has increased. The growth in policies in-force does not
correspond directly with the change in earned premiums due to the effect of changes in earned pricing, changes in the average premium
per policy and because policy in-force counts are as of a point in time rather than over a period of time.