The Hartford 2007 Annual Report Download - page 180
Download and view the complete annual report
Please find page 180 of the 2007 The Hartford annual report below. You can navigate through the pages in the report by either clicking on the pages listed below, or by using the keyword search tool below to find specific information within the annual report.-
 1
1 -
2
-
3
-
4
-
5
-
6
-
7
-
8
-
9
-
10
-
11
-
12
-
13
-
14
-
15
-
16
-
17
-
18
-
19
-
20
-
21
-
22
-
23
-
24
-
25
-
26
-
27
-
28
-
29
-
30
-
31
-
32
-
33
-
34
-
35
-
36
-
37
-
38
-
39
-
40
-
41
-
42
-
43
-
44
-
45
-
46
-
47
-
48
-
49
-
50
-
51
-
52
-
53
-
54
-
55
-
56
-
57
-
58
-
59
-
60
-
61
-
62
-
63
-
64
-
65
-
66
-
67
-
68
-
69
-
70
-
71
-
72
-
73
-
74
-
75
-
76
-
77
-
78
-
79
-
80
-
81
-
82
-
83
-
84
-
85
-
86
-
87
-
88
-
89
-
90
-
91
-
92
-
93
-
94
-
95
-
96
-
97
-
98
-
99
-
100
-
101
-
102
-
103
-
104
-
105
-
106
-
107
-
108
-
109
-
110
-
111
-
112
-
113
-
114
-
115
-
116
-
117
-
118
-
119
-
120
-
121
-
122
-
123
-
124
-
125
-
126
-
127
-
128
-
129
-
130
-
131
-
132
-
133
-
134
-
135
-
136
-
137
-
138
-
139
-
140
-
141
-
142
-
143
-
144
-
145
-
146
-
147
-
148
-
149
-
150
-
151
-
152
-
153
-
154
-
155
-
156
-
157
-
158
-
159
-
160
-
161
-
162
-
163
-
164
-
165
-
166
-
167
-
168
-
169
-
 170
170 -
 171
171 -
 172
172 -
 173
173 -
 174
174 -
 175
175 -
 176
176 -
 177
177 -
 178
178 -
 179
179 -
 180
180 -
 181
181 -
 182
182 -
 183
183 -
 184
184 -
 185
185 -
 186
186 -
 187
187 -
 188
188 -
 189
189 -
 190
190 -
191
-
192
-
193
-
194
-
195
-
196
-
197
-
198
-
199
-
200
-
201
-
202
-
203
-
204
-
205
-
206
-
207
-
208
-
209
-
210
-
211
-
212
-
213
-
214
-
215
-
216
-
217
-
218
-
219
-
220
-
221
-
222
-
223
-
224
-
225
-
226
-
227
-
228
-
229
-
230
-
231
-
232
-
233
-
234
-
235
-
236
-
237
-
238
-
239
-
240
-
241
-
242
-
243
-
244
-
245
-
246
-
247
-
248
-
249
-
250
-
251
-
252
-
253
-
254
-
255
-
256
-
257
-
258
-
259
-
260
-
261
-
262
-
263
-
264
-
265
-
266
-
267
-
268
-
269
-
270
-
271
-
272
-
273
-
274
-
275
-
276
 |
 |

F-3
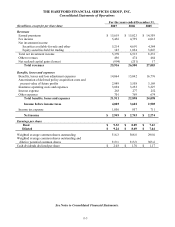
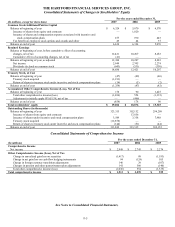
THE HARTFORD FINANCIAL SERVICES GROUP, INC.
Consolidated Statements of Operations
For the years ended December 31,
(In millions, except for per share data) 2007 2006 2005
Revenues
Earned premiums $ 15,619 $ 15,023 $ 14,359
Fee income 5,436 4,739 4,012
Net investment income
Securities available-for-sale and other 5,214 4,691 4,384
Equity securities held for trading 145 1,824 3,847
Total net investment income 5,359 6,515 8,231
Other revenues 496 474 464
Net realized capital gains (losses) (994) (251) 17
Total revenues 25,916 26,500 27,083
Benefits, losses and expenses
Benefits, losses and loss adjustment expenses 14,064 15,042 16,776
Amortization of deferred policy acquisition costs and
present value of future profits
2,989
3,558
3,169
Insurance operating costs and expenses 3,894 3,252 3,227
Interest expense 263 277 252
Other expenses 701 769 674
Total benefits, losses and expenses 21,911 22,898 24,098
Income before income taxes
4,005
3,602
2,985
Income tax expense
1,056
857
711
Net income
$
2,949
$
2,745
$
2,274
Earnings per share
Basic $ 9.32 $ 8.89 $ 7.63
Diluted $ 9.24 $ 8.69 $ 7.44
Weighted average common shares outstanding
316.3
308.8
298.0
Weighted average common shares outstanding and
dilutive potential common shares
319.1
315.9
305.6
Cash dividends declared per share $ 2.03 $ 1.70 $ 1.17
See Notes to Consolidated Financial Statements.