The Hartford 2007 Annual Report Download - page 76
Download and view the complete annual report
Please find page 76 of the 2007 The Hartford annual report below. You can navigate through the pages in the report by either clicking on the pages listed below, or by using the keyword search tool below to find specific information within the annual report.-
 1
1 -
2
-
3
-
4
-
5
-
6
-
7
-
8
-
9
-
10
-
11
-
12
-
13
-
14
-
15
-
16
-
17
-
18
-
19
-
20
-
21
-
22
-
23
-
24
-
25
-
26
-
27
-
28
-
29
-
30
-
31
-
32
-
33
-
34
-
35
-
36
-
37
-
38
-
39
-
40
-
41
-
42
-
43
-
44
-
45
-
46
-
47
-
48
-
49
-
50
-
51
-
52
-
53
-
54
-
55
-
56
-
57
-
58
-
59
-
60
-
61
-
62
-
63
-
64
-
65
-
 66
66 -
 67
67 -
 68
68 -
 69
69 -
 70
70 -
 71
71 -
 72
72 -
 73
73 -
 74
74 -
 75
75 -
 76
76 -
 77
77 -
 78
78 -
 79
79 -
 80
80 -
 81
81 -
 82
82 -
 83
83 -
 84
84 -
 85
85 -
 86
86 -
87
-
88
-
89
-
90
-
91
-
92
-
93
-
94
-
95
-
96
-
97
-
98
-
99
-
100
-
101
-
102
-
103
-
104
-
105
-
106
-
107
-
108
-
109
-
110
-
111
-
112
-
113
-
114
-
115
-
116
-
117
-
118
-
119
-
120
-
121
-
122
-
123
-
124
-
125
-
126
-
127
-
128
-
129
-
130
-
131
-
132
-
133
-
134
-
135
-
136
-
137
-
138
-
139
-
140
-
141
-
142
-
143
-
144
-
145
-
146
-
147
-
148
-
149
-
150
-
151
-
152
-
153
-
154
-
155
-
156
-
157
-
158
-
159
-
160
-
161
-
162
-
163
-
164
-
165
-
166
-
167
-
168
-
169
-
170
-
171
-
172
-
173
-
174
-
175
-
176
-
177
-
178
-
179
-
180
-
181
-
182
-
183
-
184
-
185
-
186
-
187
-
188
-
189
-
190
-
191
-
192
-
193
-
194
-
195
-
196
-
197
-
198
-
199
-
200
-
201
-
202
-
203
-
204
-
205
-
206
-
207
-
208
-
209
-
210
-
211
-
212
-
213
-
214
-
215
-
216
-
217
-
218
-
219
-
220
-
221
-
222
-
223
-
224
-
225
-
226
-
227
-
228
-
229
-
230
-
231
-
232
-
233
-
234
-
235
-
236
-
237
-
238
-
239
-
240
-
241
-
242
-
243
-
244
-
245
-
246
-
247
-
248
-
249
-
250
-
251
-
252
-
253
-
254
-
255
-
256
-
257
-
258
-
259
-
260
-
261
-
262
-
263
-
264
-
265
-
266
-
267
-
268
-
269
-
270
-
271
-
272
-
273
-
274
-
275
-
276
 |
 |

76
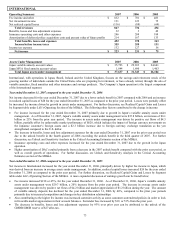
PROPERTY & CASUALTY
Executive Overview
Property & Casualty is organized into five reporting segments: the underwriting segments of Personal Lines, Small Commercial, Middle
Market and Specialty Commercial (collectively “Ongoing Operations”); and the Other Operations segment. In 2007, Property &
Casualty changed its reporting segments to reflect the current manner by which its chief operating decision maker views and manages
the business. All segment data for prior reporting periods have been adjusted to reflect the current segment reporting.
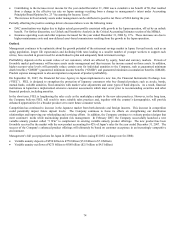
Property & Casualty provides a number of coverages, as well as insurance related services, to businesses throughout the United States,
including workers' compensation, property, automobile, liability, umbrella, specialty casualty, marine, livestock, fidelity, surety,
professional liability and directors and officers’ liability coverages. Property & Casualty also provides automobile, homeowners and
home-based business coverage to individuals throughout the United States as well as insurance-related services to businesses.
Property & Casualty derives its revenues principally from premiums earned for insurance coverages provided to insureds, investment
income, and, to a lesser extent, from fees earned for services provided to third parties and net realized capital gains and losses.
Premiums charged for insurance coverages are earned principally on a pro rata basis over the terms of the related policies in-force.
Service fees principally include revenues from third party claims administration services provided by Specialty Risk Services and
revenues from member contact center services provided through the AARP Health program.
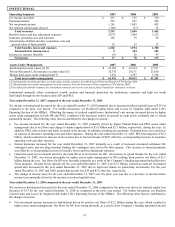
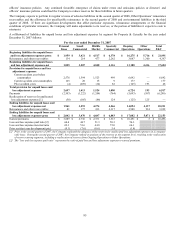
Total Property & Casualty Financial Highlights
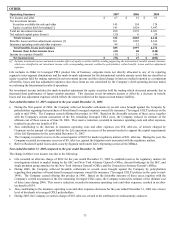
Earned Premiums
Earned premium growth is an objective for Personal Lines, Small Commercial and Middle Market. Earned premium growth is not a
specific objective for Specialty Commercial since Specialty Commercial is comprised of transactional businesses where premium
writings may fluctuate based on the segment’ s view of perceived market opportunity. Written premiums are earned over the policy
term, which is six months for certain Personal Lines auto business and 12 months for substantially all of the remainder of the
Company’ s business. Written pricing, new business growth and premium renewal retention are factors that contribute to growth in
written and earned premium.
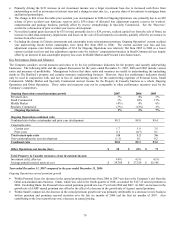
Written premiums [1] 2007 2006 2005
Personal Lines $ 3,947 $ 3,877 $ 3,676
Small Commercial 2,747 2,728 2,545
Middle Market 2,257 2,445 2,445
Specialty Commercial 1,484 1,608 1,817
Other Operations 5 4 4
Total $ 10,440 $ 10,662 $ 10,487
Earned premiums [1]
Personal Lines $ 3,889 $ 3,760 $ 3,610
Small Commercial 2,736 2,652 2,421
Middle Market 2,351 2,454 2,355
Specialty Commercial 1,515 1,562 1,766
Other Operations 5 5 4
Total $ 10,496 $ 10,433 $ 10,156
[1] The difference between written premiums and earned premiums is attributable to the change in unearned premium reserve.
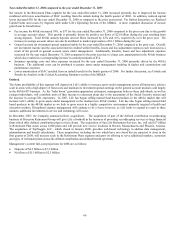
Year ended December 31, 2007 compared to the year ended December 31, 2006
Earned Premiums
Total Property & Casualty earned premiums increased by $63 due to an increase in Personal Lines and Small Commercial, partially
offset by a decrease in Middle Market and Specialty Commercial.
• In Personal Lines, earned premium grew by $129, or 3%, primarily due to an increase in AARP and Agency earned premiums.
AARP earned premium grew primarily due to an increase in the size of the AARP target market, the effect of direct marketing
programs and the effect of cross selling homeowners insurance to insureds who have auto policies. Agency earned premium grew
as a result of an increase in the number of agency appointments and further refinement of the Dimensions class plans. Partially
offsetting this growth was the effect of the sale of the Omni non-standard auto business in the fourth quarter of 2006 which
accounted for $127 of earned premium in 2006. Excluding Omni, Personal Lines’ earned premiums grew $251, or 7%, for the year
ended December 31, 2007.
• In Small Commercial, earned premiums increased $84, or 3%, primarily due to new business premiums outpacing non-renewals for
workers’ compensation business over the last six months of 2006 and the first six months of 2007.