The Hartford 2007 Annual Report Download - page 213
Download and view the complete annual report
Please find page 213 of the 2007 The Hartford annual report below. You can navigate through the pages in the report by either clicking on the pages listed below, or by using the keyword search tool below to find specific information within the annual report.-
 1
1 -
2
-
3
-
4
-
5
-
6
-
7
-
8
-
9
-
10
-
11
-
12
-
13
-
14
-
15
-
16
-
17
-
18
-
19
-
20
-
21
-
22
-
23
-
24
-
25
-
26
-
27
-
28
-
29
-
30
-
31
-
32
-
33
-
34
-
35
-
36
-
37
-
38
-
39
-
40
-
41
-
42
-
43
-
44
-
45
-
46
-
47
-
48
-
49
-
50
-
51
-
52
-
53
-
54
-
55
-
56
-
57
-
58
-
59
-
60
-
61
-
62
-
63
-
64
-
65
-
66
-
67
-
68
-
69
-
70
-
71
-
72
-
73
-
74
-
75
-
76
-
77
-
78
-
79
-
80
-
81
-
82
-
83
-
84
-
85
-
86
-
87
-
88
-
89
-
90
-
91
-
92
-
93
-
94
-
95
-
96
-
97
-
98
-
99
-
100
-
101
-
102
-
103
-
104
-
105
-
106
-
107
-
108
-
109
-
110
-
111
-
112
-
113
-
114
-
115
-
116
-
117
-
118
-
119
-
120
-
121
-
122
-
123
-
124
-
125
-
126
-
127
-
128
-
129
-
130
-
131
-
132
-
133
-
134
-
135
-
136
-
137
-
138
-
139
-
140
-
141
-
142
-
143
-
144
-
145
-
146
-
147
-
148
-
149
-
150
-
151
-
152
-
153
-
154
-
155
-
156
-
157
-
158
-
159
-
160
-
161
-
162
-
163
-
164
-
165
-
166
-
167
-
168
-
169
-
170
-
171
-
172
-
173
-
174
-
175
-
176
-
177
-
178
-
179
-
180
-
181
-
182
-
183
-
184
-
185
-
186
-
187
-
188
-
189
-
190
-
191
-
192
-
193
-
194
-
195
-
196
-
197
-
198
-
199
-
200
-
201
-
202
-
 203
203 -
 204
204 -
 205
205 -
 206
206 -
 207
207 -
 208
208 -
 209
209 -
 210
210 -
 211
211 -
 212
212 -
 213
213 -
 214
214 -
 215
215 -
 216
216 -
 217
217 -
 218
218 -
 219
219 -
 220
220 -
 221
221 -
 222
222 -
 223
223 -
224
-
225
-
226
-
227
-
228
-
229
-
230
-
231
-
232
-
233
-
234
-
235
-
236
-
237
-
238
-
239
-
240
-
241
-
242
-
243
-
244
-
245
-
246
-
247
-
248
-
249
-
250
-
251
-
252
-
253
-
254
-
255
-
256
-
257
-
258
-
259
-
260
-
261
-
262
-
263
-
264
-
265
-
266
-
267
-
268
-
269
-
270
-
271
-
272
-
273
-
274
-
275
-
276
 |
 |

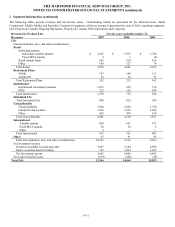
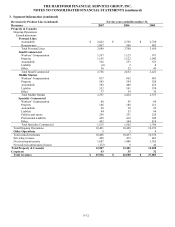
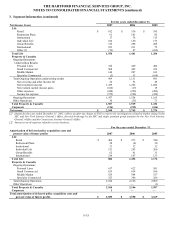
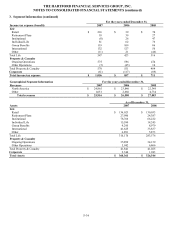
THE HARTFORD FINANCIAL SERVICES GROUP, INC.
NOTES TO CONSOLIDATED FINANCIAL STATEMENTS (continued)
F-36
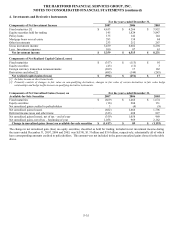
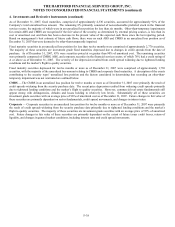
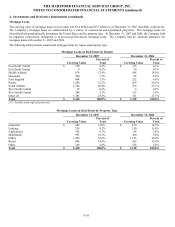
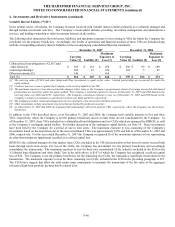
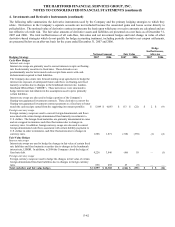
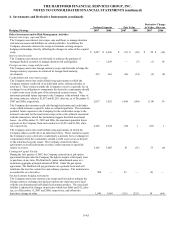
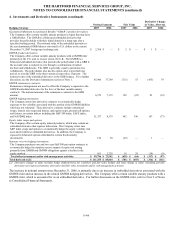
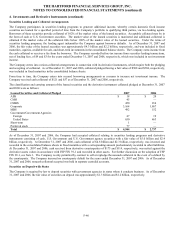
4. Investments and Derivative Instruments (continued)
Components of Fixed Maturity Investments
As of December 31, 2007 As of December 31, 2006
Amortized
Cost
Gross
Unrealized
Gains
Gross
Unrealized
Losses
Fair
Value
Amortized
Cost
Gross
Unrealized
Gains
Gross
Unrealized
Losses
Fair
Value
Bonds and Notes
ABS $ 9,515 $ 33 $ (633) $ 8,915 $ 7,687 $ 54 $ (50) $ 7,691
CMOs
Agency backed 1,191 32 (4) 1,219 1,184 17 (8) 1,193
Non-agency backed 525 4 (3) 526 116 — (1) 115
Commercial mortgage-backed
securities (“CMBS”)
17,625
244
(838)
17,031
16,816
232
(148)
16,900
Corporate 34,118 1,022 (942) 34,198 35,069 1,193 (371) 35,891
Government/Government agencies
Foreign 999 59 (5) 1,053 1,213 87 (6) 1,294
United States 836 22 (3) 855 848 5 (7) 846
MBS 2,757 26 (20) 2,763 2,742 5 (45) 2,702
States, municipalities and political
subdivisions
13,152
427
(90)
13,489
11,897
536
(27)
12,406
Redeemable preferred stock 6 — — 6 36 — — 36
Total fixed maturities $ 80,724 $ 1,869 $ (2,538) $ 80,055 $ 77,608 $ 2,129 $ (663) $ 79,074
The amortized cost and estimated fair value of fixed maturity investments at December 31, 2007 by contractual maturity year are
shown below.
Maturity Amortized Cost Fair Value
One year or less $ 1,486 $ 1,556
Over one year through five years 12,208 12,570
Over five years through ten years 12,583 12,585
Over ten years 40,459 39,921
Subtotal 66,736 66,632
ABS, MBS, and CMOs 13,988 13,423
Total $ 80,724 $ 80,055
Estimated maturities may differ from contractual maturities due to security call or prepayment provisions because of the potential for
prepayment on certain mortgage- and asset-backed securities which is why ABS, MBS, and CMOs are not categorized by contractual
maturity. The CMBS are categorized by contractual maturity because they generally are not subject to prepayment risk as these
securities are generally structured to include forms of call protections such as yield maintenance charges, prepayment penalties or
lockouts, and defeasance.
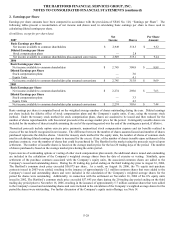
Sales of Fixed Maturity and Available-for-Sale Equity Security Investments
For the years ended December 31,
2007 2006 2005
Sale of Fixed Maturities
Sale proceeds $ 21,968 $ 26,827 $ 25,385
Gross gains 424 427 497
Gross losses (276) (407) (364)
Sale of Available-for-Sale Equity Securities
Sale proceeds $ 468 $ 514 $ 105
Gross gains 28 11 12
Gross losses (15) (14) —