The Hartford 2007 Annual Report Download - page 112
Download and view the complete annual report
Please find page 112 of the 2007 The Hartford annual report below. You can navigate through the pages in the report by either clicking on the pages listed below, or by using the keyword search tool below to find specific information within the annual report.-
 1
1 -
2
-
3
-
4
-
5
-
6
-
7
-
8
-
9
-
10
-
11
-
12
-
13
-
14
-
15
-
16
-
17
-
18
-
19
-
20
-
21
-
22
-
23
-
24
-
25
-
26
-
27
-
28
-
29
-
30
-
31
-
32
-
33
-
34
-
35
-
36
-
37
-
38
-
39
-
40
-
41
-
42
-
43
-
44
-
45
-
46
-
47
-
48
-
49
-
50
-
51
-
52
-
53
-
54
-
55
-
56
-
57
-
58
-
59
-
60
-
61
-
62
-
63
-
64
-
65
-
66
-
67
-
68
-
69
-
70
-
71
-
72
-
73
-
74
-
75
-
76
-
77
-
78
-
79
-
80
-
81
-
82
-
83
-
84
-
85
-
86
-
87
-
88
-
89
-
90
-
91
-
92
-
93
-
94
-
95
-
96
-
97
-
98
-
99
-
100
-
101
-
 102
102 -
 103
103 -
 104
104 -
 105
105 -
 106
106 -
 107
107 -
 108
108 -
 109
109 -
 110
110 -
 111
111 -
 112
112 -
 113
113 -
 114
114 -
 115
115 -
 116
116 -
 117
117 -
 118
118 -
 119
119 -
 120
120 -
 121
121 -
 122
122 -
123
-
124
-
125
-
126
-
127
-
128
-
129
-
130
-
131
-
132
-
133
-
134
-
135
-
136
-
137
-
138
-
139
-
140
-
141
-
142
-
143
-
144
-
145
-
146
-
147
-
148
-
149
-
150
-
151
-
152
-
153
-
154
-
155
-
156
-
157
-
158
-
159
-
160
-
161
-
162
-
163
-
164
-
165
-
166
-
167
-
168
-
169
-
170
-
171
-
172
-
173
-
174
-
175
-
176
-
177
-
178
-
179
-
180
-
181
-
182
-
183
-
184
-
185
-
186
-
187
-
188
-
189
-
190
-
191
-
192
-
193
-
194
-
195
-
196
-
197
-
198
-
199
-
200
-
201
-
202
-
203
-
204
-
205
-
206
-
207
-
208
-
209
-
210
-
211
-
212
-
213
-
214
-
215
-
216
-
217
-
218
-
219
-
220
-
221
-
222
-
223
-
224
-
225
-
226
-
227
-
228
-
229
-
230
-
231
-
232
-
233
-
234
-
235
-
236
-
237
-
238
-
239
-
240
-
241
-
242
-
243
-
244
-
245
-
246
-
247
-
248
-
249
-
250
-
251
-
252
-
253
-
254
-
255
-
256
-
257
-
258
-
259
-
260
-
261
-
262
-
263
-
264
-
265
-
266
-
267
-
268
-
269
-
270
-
271
-
272
-
273
-
274
-
275
-
276
 |
 |
112
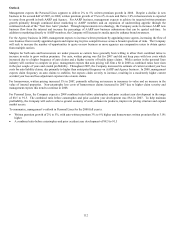
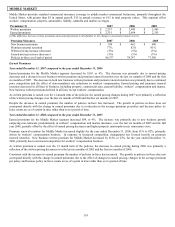
Outlook
Management expects the Personal Lines segment to deliver 2% to 5% written premium growth in 2008. Despite a decline in new
business in the second half of 2007, in 2008, written premium growth of 3% to 6% in auto and flat to 3.0% in homeowners is expected
to come from growth in both AARP and Agency. For AARP business, management expects to achieve its targeted written premium
growth primarily through continued direct marketing to AARP members and an expansion of underwriting appetite through the
continued roll-out of the “Next Gen Auto” product. Through improvements in technology, the Company seeks to increase AARP new
business flow from the internet and increase the percentage of AARP new business submissions that can be quoted real-time. In
addition to marketing directly to AARP members, the Company will increase its media spend to enhance brand awareness.
For the Agency business in 2008, management expects to increase written premium by appointing more agents, increasing the flow of
new business from recently appointed agents and improving its price competitiveness across a broader spectrum of risks. The Company
will seek to increase the number of opportunities to quote on new business as more agencies use comparative raters to obtain quotes
from multiple carriers.
Margins for both auto and homeowners are under pressure as carriers have generally been willing to allow their combined ratios to
increase in order to grow written premium. For auto, written pricing was flat for 2007 and did not keep pace with loss costs which
increased due to a higher frequency of auto claims and a higher severity of bodily injury claims. While carriers in the personal lines
industry will continue to compete on price, management expects that auto pricing will firm a bit in 2008 as combined ratios have risen
in the past couple of years and eroded profitability. Throughout 2007, the Company increased its estimate of current accident year loss
costs for auto liability claims, due primarily to higher than anticipated frequency on AARP and Agency business. In 2008, management
expects claim frequency on auto claims to stabilize, but expects claim severity to increase, resulting in a moderately higher current
accident year loss and loss adjustment expense ratio on auto claims.
For homeowners, written pricing increased 5% in 2007, primarily reflecting an increase in insurance to value and an increase in the
value of insured properties. Non-catastrophe loss costs of homeowners claims increased in 2007 due to higher claim severity and
management expects this trend to continue in 2008.
For Personal Lines, the Company expects a 2008 combined ratio before catastrophes and prior accident year development in the range
of 88.5 to 91.5. The combined ratio before catastrophes and prior accident year development was 88.6 in 2007. To help maintain
profitability, the Company will seek to achieve greater economy of scale, enhance its products, improve its pricing structure and expand
market access.
To summarize, management’ s outlook in Personal Lines for the 2008 full year is:
• Written premium growth of 2% to 5%, with auto written premium 3% to 6% higher and homeowners written premium flat to 3.0%
higher
• A combined ratio before catastrophes and prior accident year development of 88.5 to 91.5