The Hartford 2007 Annual Report Download - page 115
Download and view the complete annual report
Please find page 115 of the 2007 The Hartford annual report below. You can navigate through the pages in the report by either clicking on the pages listed below, or by using the keyword search tool below to find specific information within the annual report.-
 1
1 -
2
-
3
-
4
-
5
-
6
-
7
-
8
-
9
-
10
-
11
-
12
-
13
-
14
-
15
-
16
-
17
-
18
-
19
-
20
-
21
-
22
-
23
-
24
-
25
-
26
-
27
-
28
-
29
-
30
-
31
-
32
-
33
-
34
-
35
-
36
-
37
-
38
-
39
-
40
-
41
-
42
-
43
-
44
-
45
-
46
-
47
-
48
-
49
-
50
-
51
-
52
-
53
-
54
-
55
-
56
-
57
-
58
-
59
-
60
-
61
-
62
-
63
-
64
-
65
-
66
-
67
-
68
-
69
-
70
-
71
-
72
-
73
-
74
-
75
-
76
-
77
-
78
-
79
-
80
-
81
-
82
-
83
-
84
-
85
-
86
-
87
-
88
-
89
-
90
-
91
-
92
-
93
-
94
-
95
-
96
-
97
-
98
-
99
-
100
-
101
-
102
-
103
-
104
-
 105
105 -
 106
106 -
 107
107 -
 108
108 -
 109
109 -
 110
110 -
 111
111 -
 112
112 -
 113
113 -
 114
114 -
 115
115 -
 116
116 -
 117
117 -
 118
118 -
 119
119 -
 120
120 -
 121
121 -
 122
122 -
 123
123 -
 124
124 -
 125
125 -
126
-
127
-
128
-
129
-
130
-
131
-
132
-
133
-
134
-
135
-
136
-
137
-
138
-
139
-
140
-
141
-
142
-
143
-
144
-
145
-
146
-
147
-
148
-
149
-
150
-
151
-
152
-
153
-
154
-
155
-
156
-
157
-
158
-
159
-
160
-
161
-
162
-
163
-
164
-
165
-
166
-
167
-
168
-
169
-
170
-
171
-
172
-
173
-
174
-
175
-
176
-
177
-
178
-
179
-
180
-
181
-
182
-
183
-
184
-
185
-
186
-
187
-
188
-
189
-
190
-
191
-
192
-
193
-
194
-
195
-
196
-
197
-
198
-
199
-
200
-
201
-
202
-
203
-
204
-
205
-
206
-
207
-
208
-
209
-
210
-
211
-
212
-
213
-
214
-
215
-
216
-
217
-
218
-
219
-
220
-
221
-
222
-
223
-
224
-
225
-
226
-
227
-
228
-
229
-
230
-
231
-
232
-
233
-
234
-
235
-
236
-
237
-
238
-
239
-
240
-
241
-
242
-
243
-
244
-
245
-
246
-
247
-
248
-
249
-
250
-
251
-
252
-
253
-
254
-
255
-
256
-
257
-
258
-
259
-
260
-
261
-
262
-
263
-
264
-
265
-
266
-
267
-
268
-
269
-
270
-
271
-
272
-
273
-
274
-
275
-
276
 |
 |

115
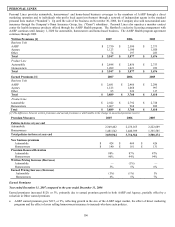
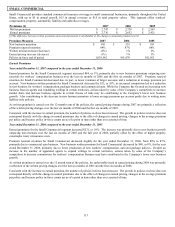
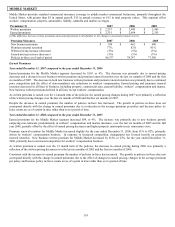
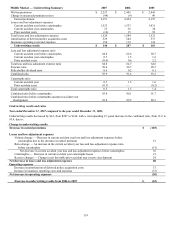
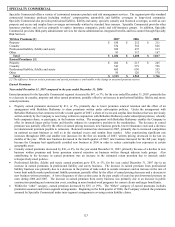
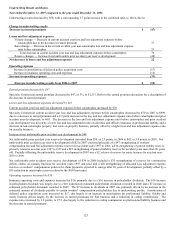
Earned premium increased by $84
Small Commercial earned premium increased by $84, or 3%, to $2,736. Refer to the earned premium discussion for a description of the
increase in earned premium.
Losses and loss adjustment expenses decreased by $55
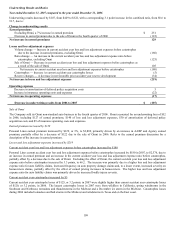
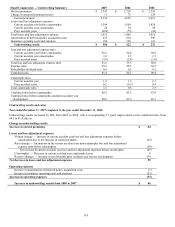
Current accident year loss and loss adjustment expenses before catastrophes increased by $85
Small Commercial current accident year loss and loss adjustment expenses before catastrophes increased by $85 in 2007, to $1,594, due
to an increase in earned premium and a 1.4 point increase in the current accident year loss and loss adjustment expense ratio before
catastrophes, to 58.3. The 1.4 point increase in the current accident year loss and loss adjustment expense ratio before catastrophes was
primarily due to a higher loss ratio and loss adjustment expense ratio for package business and commercial auto claims, partially offset
by a lower loss and loss adjustment expense ratio for workers’ compensation claims. The higher loss and loss adjustment expense ratio
on package business was primarily driven by an increase in the number of individual large losses and the higher loss and loss adjustment
expense ratio for auto claims was driven, in part, by earned pricing decreases. Expected loss and loss adjustment expenses on workers’
compensation claims for the 2007 accident year were lower as the assumed level of medical claim severity was not as high as it had
been for the 2006 accident year.
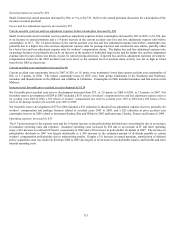
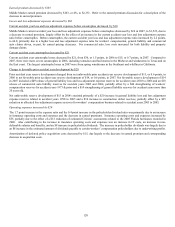
Current accident year catastrophes decreased by $6
Current accident year catastrophe losses in 2007 of $28, or 1.0 point, were moderately lower than current accident year catastrophes of
$34, or 1.3 points, in 2006. The largest catastrophe losses in 2007 were from spring windstorms in the Southeast and Northeast,
tornadoes and thunderstorms in the Midwest and wildfires in California. Catastrophes in 2006 included tornadoes and hail storms in the
Midwest.
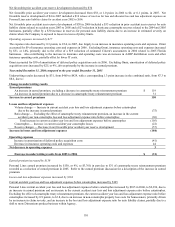
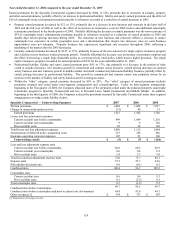
Increase in net favorable prior accident year development by $134
Net favorable prior accident year reserve development increased from $75, or 2.8 points, in 2006 to $209, or 7.6 points, in 2007. Net
favorable reserve development of $209 in 2007 included a $151 release of workers’ compensation loss and loss adjustment expense reserves
for accident years 2002 to 2006, a $33 release of workers’ compensation loss reserves accident years 1987 to 2000 and a $30 release of loss
reserves for package business for accident years 2003 to 2006.
Net favorable reserve development of $75 in 2006 included a $33 reduction in allocated loss adjustment expense reserves, primarily for
workers’ compensation and package business related to accident years 2003 to 2005, and a $22 reduction in prior accident year
catastrophe reserves in 2006 related to hurricanes Katrina, Rita and Wilma in 2005 and hurricanes Charley, Frances and Jeanne in 2004.
Operating expenses increased by $53
The 0.7 point increase in the expense ratio and the 0.4 point increase in the policyholder dividend ratio was primarily due to an increase
in insurance operating costs and expenses. Insurance operating costs increased by $52 due to an increase in IT and other operating
costs, a $10 decrease in estimated Citizens’ assessments in 2006 and a $10 increase in policyholder dividends in 2007. The increase in
policyholder dividends in 2007 was largely attributable to a $10 increase in the estimated amount of dividends payable to certain
workers’ compensation policyholders due to underwriting profits. Despite a 3% increase in earned premium, amortization of deferred
policy acquisition costs was relatively flat from 2006 to 2007 due largely to an increase in non-deferrable salaries and benefits and other
internal operating costs.