The Hartford 2007 Annual Report Download - page 58
Download and view the complete annual report
Please find page 58 of the 2007 The Hartford annual report below. You can navigate through the pages in the report by either clicking on the pages listed below, or by using the keyword search tool below to find specific information within the annual report.-
 1
1 -
2
-
3
-
4
-
5
-
6
-
7
-
8
-
9
-
10
-
11
-
12
-
13
-
14
-
15
-
16
-
17
-
18
-
19
-
20
-
21
-
22
-
23
-
24
-
25
-
26
-
27
-
28
-
29
-
30
-
31
-
32
-
33
-
34
-
35
-
36
-
37
-
38
-
39
-
40
-
41
-
42
-
43
-
44
-
45
-
46
-
47
-
 48
48 -
 49
49 -
 50
50 -
 51
51 -
 52
52 -
 53
53 -
 54
54 -
 55
55 -
 56
56 -
 57
57 -
 58
58 -
 59
59 -
 60
60 -
 61
61 -
 62
62 -
 63
63 -
 64
64 -
 65
65 -
 66
66 -
 67
67 -
 68
68 -
69
-
70
-
71
-
72
-
73
-
74
-
75
-
76
-
77
-
78
-
79
-
80
-
81
-
82
-
83
-
84
-
85
-
86
-
87
-
88
-
89
-
90
-
91
-
92
-
93
-
94
-
95
-
96
-
97
-
98
-
99
-
100
-
101
-
102
-
103
-
104
-
105
-
106
-
107
-
108
-
109
-
110
-
111
-
112
-
113
-
114
-
115
-
116
-
117
-
118
-
119
-
120
-
121
-
122
-
123
-
124
-
125
-
126
-
127
-
128
-
129
-
130
-
131
-
132
-
133
-
134
-
135
-
136
-
137
-
138
-
139
-
140
-
141
-
142
-
143
-
144
-
145
-
146
-
147
-
148
-
149
-
150
-
151
-
152
-
153
-
154
-
155
-
156
-
157
-
158
-
159
-
160
-
161
-
162
-
163
-
164
-
165
-
166
-
167
-
168
-
169
-
170
-
171
-
172
-
173
-
174
-
175
-
176
-
177
-
178
-
179
-
180
-
181
-
182
-
183
-
184
-
185
-
186
-
187
-
188
-
189
-
190
-
191
-
192
-
193
-
194
-
195
-
196
-
197
-
198
-
199
-
200
-
201
-
202
-
203
-
204
-
205
-
206
-
207
-
208
-
209
-
210
-
211
-
212
-
213
-
214
-
215
-
216
-
217
-
218
-
219
-
220
-
221
-
222
-
223
-
224
-
225
-
226
-
227
-
228
-
229
-
230
-
231
-
232
-
233
-
234
-
235
-
236
-
237
-
238
-
239
-
240
-
241
-
242
-
243
-
244
-
245
-
246
-
247
-
248
-
249
-
250
-
251
-
252
-
253
-
254
-
255
-
256
-
257
-
258
-
259
-
260
-
261
-
262
-
263
-
264
-
265
-
266
-
267
-
268
-
269
-
270
-
271
-
272
-
273
-
274
-
275
-
276
 |
 |

58
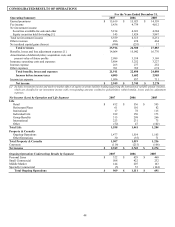
• The Group Benefits loss ratio, excluding buyouts, for 2006 decreased due to favorable mortality experience, partially offset by
unfavorable morbidity experience. Loss ratios experience volatility in period over period comparisons due to fluctuations in
mortality and morbidity experience.
• International - Japan’ s expense ratio declined in 2006 as Japan further leveraged the existing infrastructure as it attains economies
of scale.
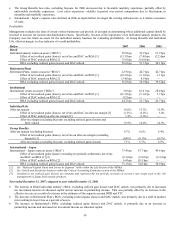
Profitability
Management evaluates the rates of return various businesses can provide as an input in determining where additional capital should be
invested to increase net income and shareholder returns. Specifically, because of the importance of its individual annuity products, the
Company uses the return on assets for the individual annuity business for evaluating profitability. In Group Benefits and Individual
Life, after-tax margin is a key indicator of overall profitability.
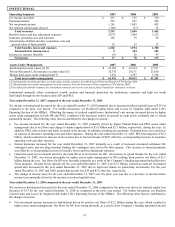
Ratios 2007 2006 2005
Retail
Individual annuity return on assets (“ROA”) 58.9 bps 39.9 bps 51.9 bps
Effect of net realized gains (losses), net of tax and DAC on ROA [1] (13.3) bps (7.4) bps (2.2) bps
Effect of DAC unlock on ROA [2] 15.6 bps (6.0) bps —
ROA excluding realized gains (losses) and DAC unlock 56.6 bps 53.3 bps 54.1 bps
Retirement Plans
Retirement Plans return on assets (“ROA”) 22.9 bps 44.7 bps 42.7 bps
Effect of net realized gains (losses), net of tax and DAC on ROA [1] (10.5) bps (3.1) bps 3.1 bps
Effect of DAC unlock on ROA [2] (3.4) bps 8.9 bps —
ROA excluding realized gains (losses) and DAC unlock 36.8 bps 38.9 bps 39.6 bps
Institutional
Institutional return on assets (“ROA”) 3.0 bps 16.6 bps 28.4 bps
Effect of net realized gains (losses), net of tax and DAC on ROA [1] (21.5) bps (5.1) bps 5.7 bps
Effect of DAC unlock on ROA [2] 0.2 bps — —
ROA excluding realized gains (losses) and DAC unlock 24.3 bps 21.7 bps 22.7 bps
Individual Life
After-tax margin 16.0% 13.3% 15.9%
Effect of net realized gains (losses), net of tax and DAC on after-tax margin [1] (1.3%) (1.5%) 1.0%
Effect of DAC unlock on after-tax margin [2] 1.4% (1.6%) —
After-tax margin (excluding buyouts) excluding realized gains (losses) and
DAC unlock 15.9% 16.4% 14.9%
Group Benefits
After-tax margin (excluding buyouts) 6.7% 6.6% 6.4%
Effect of net realized gains (losses), net of tax on after-tax margin (excluding
buyouts) [1] (0.4%) (0.1%) (0.1%)
After-tax margin (excluding buyouts) excluding realized gains (losses) 7.1% 6.7% 6.5%
International – Japan
International – Japan return on assets (“ROA”) 73.4 bps 87.7 bps 49.6 bps
Effect of net realized gains (losses) excluding net periodic settlements, net of tax
and DAC on ROA [1] [3] (8.1) bps (5.6) bps (9.3) bps
Effect of DAC unlock on ROA [2] 6.4 bps 18.5 bps —
ROA excluding realized gains (losses) and DAC unlock 75.1 bps 74.8 bps 58.9 bps
[1] See “Realized Capital Gains and Losses by Segment” table within the Life Section of the MD&A.
[2] See Unlock and Sensitivity Analysis within the Critical Accounting Estimates section of the MD&A.
[3] Included in net realized gain (losses) are amounts that represent the net periodic accruals on currency rate swaps used in the risk
management of Japan fixed annuity products.
Year ended December 31, 2007 compared to year ended December 31, 2006
• The increase in Retail individual annuity’ s ROA, excluding realized gain (losses) and DAC unlock, was primarily due to increased
net investment income on allocated capital and an increase in partnership income. This was partially offset by an increase in the
effective tax rate as a result of revisions in the estimates of the separate account DRD and FTC.
• The decrease in Retirement Plan’ s ROA, excluding realized gains (losses) and DAC unlock, was primarily due to a shift in product
mix resulting in lower fees as a percent of assets.
• The increase in Institutional’ s ROA, excluding realized gains (losses) and DAC unlock, is primarily due to an increase in
partnership income and increased net investment income on allocated capital.