The Hartford 2007 Annual Report Download - page 133
Download and view the complete annual report
Please find page 133 of the 2007 The Hartford annual report below. You can navigate through the pages in the report by either clicking on the pages listed below, or by using the keyword search tool below to find specific information within the annual report.-
 1
1 -
2
-
3
-
4
-
5
-
6
-
7
-
8
-
9
-
10
-
11
-
12
-
13
-
14
-
15
-
16
-
17
-
18
-
19
-
20
-
21
-
22
-
23
-
24
-
25
-
26
-
27
-
28
-
29
-
30
-
31
-
32
-
33
-
34
-
35
-
36
-
37
-
38
-
39
-
40
-
41
-
42
-
43
-
44
-
45
-
46
-
47
-
48
-
49
-
50
-
51
-
52
-
53
-
54
-
55
-
56
-
57
-
58
-
59
-
60
-
61
-
62
-
63
-
64
-
65
-
66
-
67
-
68
-
69
-
70
-
71
-
72
-
73
-
74
-
75
-
76
-
77
-
78
-
79
-
80
-
81
-
82
-
83
-
84
-
85
-
86
-
87
-
88
-
89
-
90
-
91
-
92
-
93
-
94
-
95
-
96
-
97
-
98
-
99
-
100
-
101
-
102
-
103
-
104
-
105
-
106
-
107
-
108
-
109
-
110
-
111
-
112
-
113
-
114
-
115
-
116
-
117
-
118
-
119
-
120
-
121
-
122
-
 123
123 -
 124
124 -
 125
125 -
 126
126 -
 127
127 -
 128
128 -
 129
129 -
 130
130 -
 131
131 -
 132
132 -
 133
133 -
 134
134 -
 135
135 -
 136
136 -
 137
137 -
 138
138 -
 139
139 -
 140
140 -
 141
141 -
 142
142 -
 143
143 -
144
-
145
-
146
-
147
-
148
-
149
-
150
-
151
-
152
-
153
-
154
-
155
-
156
-
157
-
158
-
159
-
160
-
161
-
162
-
163
-
164
-
165
-
166
-
167
-
168
-
169
-
170
-
171
-
172
-
173
-
174
-
175
-
176
-
177
-
178
-
179
-
180
-
181
-
182
-
183
-
184
-
185
-
186
-
187
-
188
-
189
-
190
-
191
-
192
-
193
-
194
-
195
-
196
-
197
-
198
-
199
-
200
-
201
-
202
-
203
-
204
-
205
-
206
-
207
-
208
-
209
-
210
-
211
-
212
-
213
-
214
-
215
-
216
-
217
-
218
-
219
-
220
-
221
-
222
-
223
-
224
-
225
-
226
-
227
-
228
-
229
-
230
-
231
-
232
-
233
-
234
-
235
-
236
-
237
-
238
-
239
-
240
-
241
-
242
-
243
-
244
-
245
-
246
-
247
-
248
-
249
-
250
-
251
-
252
-
253
-
254
-
255
-
256
-
257
-
258
-
259
-
260
-
261
-
262
-
263
-
264
-
265
-
266
-
267
-
268
-
269
-
270
-
271
-
272
-
273
-
274
-
275
-
276
 |
 |

133
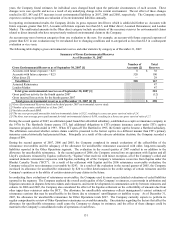
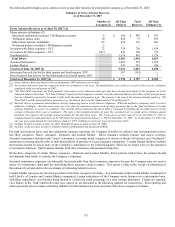
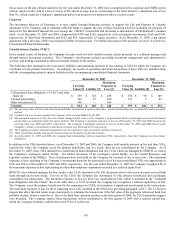
The following table displays gross asbestos reserves and other statistics by policyholder category as of December 31, 2007
Summary of Gross Asbestos Reserves
As of December 31, 2007
Number of
Accounts [2]
All Time
Paid [3]
Total
Reserves
All Time
Ultimate [3]
Gross Asbestos Reserves as of June 30, 2007 [1]
Major asbestos defendants [5]
Structured settlements (includes 3 Wellington accounts) 6 $ 260 $ 443 $ 703
Wellington (direct only) 30 858 75 933
Other major asbestos defendants 29 478 163 641
No known policies (includes 3 Wellington accounts) 5 — — —
Accounts with future exposure > $2.5 72 724 705 1,429
Accounts with future exposure < $2.5 1,077 443 130 573
Unallocated [6] 1,318 418 1,736
Total Direct 4,081 1,934 6,015
Assumed Reinsurance 1,003 552 1,555
London Market 547 381 928
Total as of June 30, 2007 [1] 5,631 2,867 8,498
Gross paid loss activity for the third quarter and fourth quarter 2007 167 (167) —
Gross incurred loss activity for the third quarter and fourth quarter 2007 — 7 7
Total as of December 31, 2007 [4] $5,798 $ 2,707 $ 8,505
[1] Gross Asbestos Reserves based on the second quarter 2007 asbestos reserve study.
[2] An account may move between categories from one evaluation to the next. Reclassifications were made as a result of the reserve evaluation
completed in the second quarter of 2007.
[3] "All Time Paid" represents the total payments with respect to the indicated claim type that have already been made by the Company as of the
indicated balance sheet date. "All Time Ultimate" represents the Company's estimate, as of the indicated balance sheet date, of the total payments
that are ultimately expected to be made to fully settle the indicated payment type. The amount is the sum of the amounts already paid (e.g. "All
Time Paid") and the estimated future payments (e.g. the amount shown in the column labeled "Total Reserves").
[4] Survival ratio is a commonly used industry ratio for comparing reserve levels between companies. While the method is commonly used, it is not a
predictive technique. Survival ratios may vary over time for numerous reasons such as large payments due to the final resolution of certain
asbestos liabilities, or reserve re-estimates. The survival ratio presented in the above table is computed by dividing the recorded reserves by the
average of the past three years of payments. The ratio is the calculated number of years the recorded reserves would survive if future annual
payments were equal to the average annual payments for the past three years. The 3-year gross survival ratio of 5.4 as December 31, 2007 is
computed based on total paid losses of $1.506 billion for the period from January 1, 2005 to December 31, 2007. As of December 31, 2007, the
one year gross paid amount for total asbestos claims is $397 resulting in a one year gross survival ratio of 6.8.
[5] Includes 26 open accounts at June 30, 2007. Included 28 open accounts at June 30, 2006.
[6] Includes closed accounts (exclusive of Major Asbestos Defendants) and unallocated IBNR.
For paid and incurred losses and loss adjustment expenses reporting, the Company classifies its asbestos and environmental reserves
into three categories: Direct, Assumed - Domestic and London Market. Direct insurance includes primary and excess coverage.
Assumed reinsurance includes both “treaty” reinsurance (covering broad categories of claims or blocks of business) and “facultative”
reinsurance (covering specific risks or individual policies of primary or excess insurance companies). London Market business includes
the business written by one or more of the Company’ s subsidiaries in the United Kingdom, which are no longer active in the insurance
or reinsurance business. Such business includes both direct insurance and assumed reinsurance.
Of the three categories of claims (Direct, Assumed – Domestic and London Market), direct policies tend to have the greatest factual
development from which to estimate the Company’ s exposures.
Assumed reinsurance exposures are inherently less predictable than direct insurance exposures because the Company may not receive
notice of a reinsurance claim until the underlying direct insurance claim is mature. This causes a delay in the receipt of information at
the reinsurer level and adds to the uncertainty of estimating related reserves.
London Market exposures are the most uncertain of the three categories of claims. As a participant in the London Market (comprised of
both Lloyd’ s of London and London Market companies), certain subsidiaries of the Company wrote business on a subscription basis,
with those subsidiaries’ involvement being limited to a relatively small percentage of a total contract placement. Claims are reported,
via a broker, to the “lead” underwriter and, once agreed to, are presented to the following markets for concurrence. This reporting and
claim agreement process makes estimating liabilities for this business the most uncertain of the three categories of claims.