The Hartford 2007 Annual Report Download - page 183
Download and view the complete annual report
Please find page 183 of the 2007 The Hartford annual report below. You can navigate through the pages in the report by either clicking on the pages listed below, or by using the keyword search tool below to find specific information within the annual report.
F-6
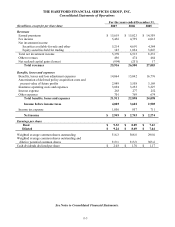
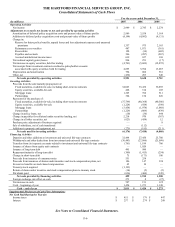
THE HARTFORD FINANCIAL SERVICES GROUP, INC.
Consolidated Statements of Cash Flows
For the years ended December 31,
(In millions) 2007 2006 2005
Operating Activities
Net income $ 2,949 $ 2,745 $ 2,274
Adjustments to reconcile net income to net cash provided by operating activities
Amortization of deferred policy acquisition costs and present value of future profits 2,989 3,558 3,169
Additions to deferred policy acquisition costs and present value of future profits (4,194) (4,092) (4,131)
Change in:
Reserve for future policy benefits, unpaid losses and loss adjustment expenses and unearned
premiums
1,357
975
2,163
Reinsurance recoverables 487 1,071 (361)
Receivables 128 (34) (682)
Payables and accruals 306 (287) (267)
Accrued and deferred income taxes 619 657 168
Net realized capital (gains) losses 994 251 (17)
Net increase in equity securities, held for trading (4,701) (5,609) (12,872)
Net receipts from investment contracts credited to policyholder accounts
associated with equity securities, held for trading 4,695 5,594 13,087
Depreciation and amortization 794 606 561
Other, net (432) 203 640
Net cash provided by operating activities 5,991 5,638 3,732
Investing Activities
Proceeds from the sale/maturity/prepayment of:
Fixed maturities, available-for-sale, including short-term investments 34,063 35,432 36,895
Equity securities, available-for-sale 468 514 105
Mortgage loans 1,365 392 511
Partnerships 324 154 226
Payments for the purchase of:
Fixed maturities, available-for-sale, including short-term investments (37,799) (40,368) (40,580)
Equity securities, available-for-sale (1,224) (924) (598)
Mortgage loans (3,454) (1,974) (1,068)
Partnerships (1,229) (809) (439)
Change in policy loans, net (10) (36) 646
Change in payables for collateral under securities lending, net 2,218 970 (367)
Change in all other securities, net (623) (454) 12
Purchase price adjustment of business acquired — — 8
Sale of subsidiary, net of cash transferred — (112) —
Additions to property and equipment, net (275) (195) (211)
Net cash used for investing activities (6,176) (7,410) (4,860)
Financing Activities
Deposits and other additions to investment and universal life-type contracts 32,494 27,450 25,780
Withdrawals and other deductions from investment and universal life-type contracts (30,443) (27,096) (25,099)
Transfers from (to) separate accounts related to investment and universal life-type contracts (761) 1,189 706
Issuance of shares from equity unit contracts — 1,020 —
Issuance of long-term debt 495 990 —
Repayment/maturity of long-term debt (300) (1,415) (250)
Change in short-term debt 75 (173) 100
Proceeds from issuance of consumer notes 551 258 —
Proceeds from issuances of shares under incentive and stock compensation plans, net 186 147 390
Excess tax benefits on stock-based compensation 45 10 —
Treasury stock acquired (1,193) — —
Return of shares under incentive and stock compensation plans to treasury stock (14) (5) (2)
Dividends paid (636) (460) (345)
Net cash provided by financing activities 499 1,915 1,280
Foreign exchange rate effect on cash 273 8 (27)
Net increase in cash 587 151 125
Cash – beginning of year 1,424 1,273 1,148
Cash – end of year $ 2,011 $ 1,424 $ 1,273
Supplemental Disclosure of Cash Flow Information:
Net Cash Paid During the Year for:
Income taxes $ 451 $ 179 $ 447
Interest $ 257 $ 274 $ 248
See Notes to Consolidated Financial Statements.


