The Hartford 2007 Annual Report Download - page 74
Download and view the complete annual report
Please find page 74 of the 2007 The Hartford annual report below. You can navigate through the pages in the report by either clicking on the pages listed below, or by using the keyword search tool below to find specific information within the annual report.-
 1
1 -
2
-
3
-
4
-
5
-
6
-
7
-
8
-
9
-
10
-
11
-
12
-
13
-
14
-
15
-
16
-
17
-
18
-
19
-
20
-
21
-
22
-
23
-
24
-
25
-
26
-
27
-
28
-
29
-
30
-
31
-
32
-
33
-
34
-
35
-
36
-
37
-
38
-
39
-
40
-
41
-
42
-
43
-
44
-
45
-
46
-
47
-
48
-
49
-
50
-
51
-
52
-
53
-
54
-
55
-
56
-
57
-
58
-
59
-
60
-
61
-
62
-
63
-
 64
64 -
 65
65 -
 66
66 -
 67
67 -
 68
68 -
 69
69 -
 70
70 -
 71
71 -
 72
72 -
 73
73 -
 74
74 -
 75
75 -
 76
76 -
 77
77 -
 78
78 -
 79
79 -
 80
80 -
 81
81 -
 82
82 -
 83
83 -
 84
84 -
85
-
86
-
87
-
88
-
89
-
90
-
91
-
92
-
93
-
94
-
95
-
96
-
97
-
98
-
99
-
100
-
101
-
102
-
103
-
104
-
105
-
106
-
107
-
108
-
109
-
110
-
111
-
112
-
113
-
114
-
115
-
116
-
117
-
118
-
119
-
120
-
121
-
122
-
123
-
124
-
125
-
126
-
127
-
128
-
129
-
130
-
131
-
132
-
133
-
134
-
135
-
136
-
137
-
138
-
139
-
140
-
141
-
142
-
143
-
144
-
145
-
146
-
147
-
148
-
149
-
150
-
151
-
152
-
153
-
154
-
155
-
156
-
157
-
158
-
159
-
160
-
161
-
162
-
163
-
164
-
165
-
166
-
167
-
168
-
169
-
170
-
171
-
172
-
173
-
174
-
175
-
176
-
177
-
178
-
179
-
180
-
181
-
182
-
183
-
184
-
185
-
186
-
187
-
188
-
189
-
190
-
191
-
192
-
193
-
194
-
195
-
196
-
197
-
198
-
199
-
200
-
201
-
202
-
203
-
204
-
205
-
206
-
207
-
208
-
209
-
210
-
211
-
212
-
213
-
214
-
215
-
216
-
217
-
218
-
219
-
220
-
221
-
222
-
223
-
224
-
225
-
226
-
227
-
228
-
229
-
230
-
231
-
232
-
233
-
234
-
235
-
236
-
237
-
238
-
239
-
240
-
241
-
242
-
243
-
244
-
245
-
246
-
247
-
248
-
249
-
250
-
251
-
252
-
253
-
254
-
255
-
256
-
257
-
258
-
259
-
260
-
261
-
262
-
263
-
264
-
265
-
266
-
267
-
268
-
269
-
270
-
271
-
272
-
273
-
274
-
275
-
276
 |
 |
74
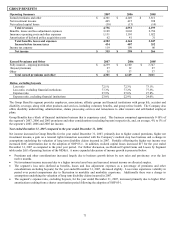
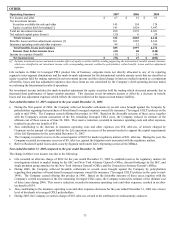
• Contributing to the increase in net income for the year ended December 31, 2006 was a cumulative tax benefit of $9, that resulted
from a change in the effective tax rate on Japan earnings resulting from a change in management’s intent under Accounting
Principles Board Opinion No. 23 "Accounting for Income Taxes".
• The increase in fixed annuity assets under management can be attributed to positive net flows of $224 during the year.
Partially offsetting the positive earnings drivers discussed above were the following items:
• DAC amortization was higher due to higher actual gross profits consistent with growth in the Japan operation, off set by an unlock
benefit. For further discussion, see Unlock and Sensitivity Analysis in the Critical Accounting Estimates section of the MD&A.
• Insurance operating costs and other expenses increased for the year ended December 31, 2006 by 11%. These increases are due to
higher maintenance costs and non-deferred asset-based commissions resulting from the growth in the Japan operation.
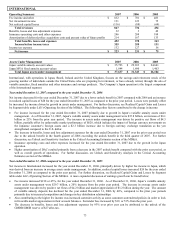
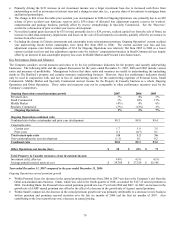
Outlook
Management continues to be optimistic about the growth potential of the retirement savings market in Japan. Several trends, such as an
aging population, longer life expectancies and declining birth rates leading to a smaller number of younger workers to support each
retiree, have resulted in greater need for an individual to plan and adequately fund retirement savings.
Profitability depends on the account values of our customers, which are affected by equity, bond and currency markets. Periods of
favorable market performance will increase assets under management and thus increase fee income earned on those assets. In addition,
higher account value levels will generally reduce certain costs for individual annuities to the Company, such as guaranteed minimum
death benefits (“GMDB”) guaranteed minimum income benefits (“GMIB”) and guaranteed minimum accumulation benefits (GMAB).
Prudent expense management is also an important component of product profitability.
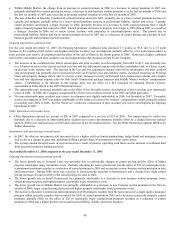
On September 30, 2007, the Financial Services Agency in Japan implemented a new law, the Financial Instruments Exchange Law
(“FIEL”). FIEL is designed to strengthen the protection of Japanese consumers who buy financial products such as stocks, bonds,
mutual funds, variable annuities, fixed annuities with market value adjustments and some types of bank deposits. As a result, financial
institutions in Japan have implemented extensive customer assessments which must occur prior to recommending securities and other
financial products, including annuities.
In the short term, FIEL is lengthening the sales cycle as the marketplace adapts to the new sales practices. However, in the long term,
the Company believes FIEL will result in more suitable sales practices and, together with the country’ s demographics, will provide
enhanced opportunities for a broader product set to meet future consumer needs.
Competition has continued to increase in the Japanese market from both domestic and foreign insurers. This increase in competition
could potentially impact future deposit levels. The Company continues to focus its efforts on strengthening our distribution
relationships and improving our wholesaling and servicing efforts. In addition, the Company continues to evaluate product designs that
meet customers’ needs while maintaining prudent risk management. In February 2007, the Company successfully launched a new
variable annuity product called “3 Win” to complement its existing variable annuity product offerings. The new product has been
favorably received by the market with the new product accounting for 42% of Japan’s sales for the year ended December 31, 2007. The
success of the Company’ s enhanced product offerings will ultimately be based on customer acceptance in an increasingly competitive
environment.
Management’ s full year projections for Japan in 2008 are as follows (using ¥110/$1 exchange rate for 2008):
• Variable annuity deposits of ¥550 billion to ¥770 billion ($5.0 billion to $7.0 billion)
• Variable annuity net flows of ¥275 billion to ¥500 billion ($2.5 billion to $4.5 billion)