The Hartford 2007 Annual Report Download - page 95
Download and view the complete annual report
Please find page 95 of the 2007 The Hartford annual report below. You can navigate through the pages in the report by either clicking on the pages listed below, or by using the keyword search tool below to find specific information within the annual report.-
 1
1 -
2
-
3
-
4
-
5
-
6
-
7
-
8
-
9
-
10
-
11
-
12
-
13
-
14
-
15
-
16
-
17
-
18
-
19
-
20
-
21
-
22
-
23
-
24
-
25
-
26
-
27
-
28
-
29
-
30
-
31
-
32
-
33
-
34
-
35
-
36
-
37
-
38
-
39
-
40
-
41
-
42
-
43
-
44
-
45
-
46
-
47
-
48
-
49
-
50
-
51
-
52
-
53
-
54
-
55
-
56
-
57
-
58
-
59
-
60
-
61
-
62
-
63
-
64
-
65
-
66
-
67
-
68
-
69
-
70
-
71
-
72
-
73
-
74
-
75
-
76
-
77
-
78
-
79
-
80
-
81
-
82
-
83
-
84
-
 85
85 -
 86
86 -
 87
87 -
 88
88 -
 89
89 -
 90
90 -
 91
91 -
 92
92 -
 93
93 -
 94
94 -
 95
95 -
 96
96 -
 97
97 -
 98
98 -
 99
99 -
 100
100 -
 101
101 -
 102
102 -
 103
103 -
 104
104 -
 105
105 -
106
-
107
-
108
-
109
-
110
-
111
-
112
-
113
-
114
-
115
-
116
-
117
-
118
-
119
-
120
-
121
-
122
-
123
-
124
-
125
-
126
-
127
-
128
-
129
-
130
-
131
-
132
-
133
-
134
-
135
-
136
-
137
-
138
-
139
-
140
-
141
-
142
-
143
-
144
-
145
-
146
-
147
-
148
-
149
-
150
-
151
-
152
-
153
-
154
-
155
-
156
-
157
-
158
-
159
-
160
-
161
-
162
-
163
-
164
-
165
-
166
-
167
-
168
-
169
-
170
-
171
-
172
-
173
-
174
-
175
-
176
-
177
-
178
-
179
-
180
-
181
-
182
-
183
-
184
-
185
-
186
-
187
-
188
-
189
-
190
-
191
-
192
-
193
-
194
-
195
-
196
-
197
-
198
-
199
-
200
-
201
-
202
-
203
-
204
-
205
-
206
-
207
-
208
-
209
-
210
-
211
-
212
-
213
-
214
-
215
-
216
-
217
-
218
-
219
-
220
-
221
-
222
-
223
-
224
-
225
-
226
-
227
-
228
-
229
-
230
-
231
-
232
-
233
-
234
-
235
-
236
-
237
-
238
-
239
-
240
-
241
-
242
-
243
-
244
-
245
-
246
-
247
-
248
-
249
-
250
-
251
-
252
-
253
-
254
-
255
-
256
-
257
-
258
-
259
-
260
-
261
-
262
-
263
-
264
-
265
-
266
-
267
-
268
-
269
-
270
-
271
-
272
-
273
-
274
-
275
-
276
 |
 |

95
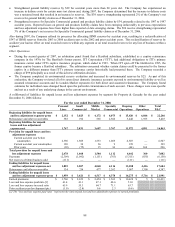
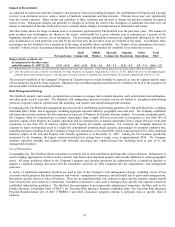
The following table summarizes the terms of the reinsurance treaties with Foundation Re and Foundation Re II that were in place as of
January 1, 2008:
Covered perils
Treaty term
Covered losses
Bond amount issued by
Foundation Re or
Foundation Re II
Hurricane loss events affecting the Gulf
and Eastern Coast of the United States
11/17/2004 to
11/24/2008
45% of $400 in losses in excess of an
index loss trigger equating to
approximately $1.3 billion in Hartford
losses
$180
Hurricane and earthquake loss events
which occur in the year following a
large hurricane or earthquake event that
has an estimated occurrence probability
of 1-in-100 years
11/17/2004 to
1/6/2009
90% of $75 in losses in excess of an
index loss trigger equating to
approximately $125 in Hartford losses
68
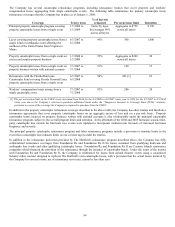
Hurricane loss events affecting the Gulf
and Eastern Coast of the United States
and loss events arising from California,
Pacific Northwest, and New Madrid
earthquakes.
2/17/2006 to
2/24/2010
26% of $400 in losses in excess of an
index loss trigger equating to
approximately $1.3 billion in Hartford
losses
105
Hurricane loss events affecting the Gulf
and Eastern Coast of the United States
11/17/2006 to
11/26/2010
45% of $400 in losses in excess of an
index loss trigger equating to
approximately $1.85 billion in Hartford
losses
180
Annual aggregate of hurricane,
earthquake and tornado/hail events in
the continuous continental United
States that result in $100 and $29.5
billion in industry losses
11/17/2006 to
1/8/2009
45% of $150 in losses in excess of an
index loss trigger equating to
approximately $462 in annual
aggregate Hartford losses
68
As of December 31, 2007, there have been no events that are expected to trigger a recovery under any of the reinsurance programs with
Foundation Re or Foundation Re II and, accordingly, the Company has not recorded any recoveries from the associated reinsurance
treaties.
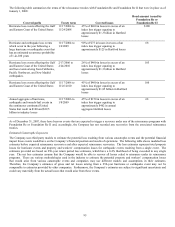
Estimated Catastrophe Exposures
The Company uses third party models to estimate the potential loss resulting from various catastrophe events and the potential financial
impact those events would have on the Company’ s financial position and results of operations. The following table shows modeled loss
estimates before expected reinsurance recoveries and after expected reinsurance recoveries. The loss estimates represent total property
losses for hurricane events and property and workers’ compensation losses for earthquake events resulting from a single event. The
estimates provided are based on 250-year return period loss estimates, which have a 0.4% likelihood of being exceeded in any single
year. The net loss estimates assume that the Company would be able to recover all losses ceded to reinsurers under its reinsurance
programs. There are various methodologies used in the industry to estimate the potential property and workers’ compensation losses
that would arise from various catastrophe events and companies may use different models and assumptions in their estimates.
Therefore, the Company’ s estimates of gross and net losses arising from a 250-year hurricane or earthquake event may not be
comparable to estimates provided by other companies. Furthermore, the Company’ s estimates are subject to significant uncertainty and
could vary materially from the actual losses that would arise from these events.