The Hartford 2007 Annual Report Download - page 57
Download and view the complete annual report
Please find page 57 of the 2007 The Hartford annual report below. You can navigate through the pages in the report by either clicking on the pages listed below, or by using the keyword search tool below to find specific information within the annual report.-
 1
1 -
2
-
3
-
4
-
5
-
6
-
7
-
8
-
9
-
10
-
11
-
12
-
13
-
14
-
15
-
16
-
17
-
18
-
19
-
20
-
21
-
22
-
23
-
24
-
25
-
26
-
27
-
28
-
29
-
30
-
31
-
32
-
33
-
34
-
35
-
36
-
37
-
38
-
39
-
40
-
41
-
42
-
43
-
44
-
45
-
46
-
 47
47 -
 48
48 -
 49
49 -
 50
50 -
 51
51 -
 52
52 -
 53
53 -
 54
54 -
 55
55 -
 56
56 -
 57
57 -
 58
58 -
 59
59 -
 60
60 -
 61
61 -
 62
62 -
 63
63 -
 64
64 -
 65
65 -
 66
66 -
 67
67 -
68
-
69
-
70
-
71
-
72
-
73
-
74
-
75
-
76
-
77
-
78
-
79
-
80
-
81
-
82
-
83
-
84
-
85
-
86
-
87
-
88
-
89
-
90
-
91
-
92
-
93
-
94
-
95
-
96
-
97
-
98
-
99
-
100
-
101
-
102
-
103
-
104
-
105
-
106
-
107
-
108
-
109
-
110
-
111
-
112
-
113
-
114
-
115
-
116
-
117
-
118
-
119
-
120
-
121
-
122
-
123
-
124
-
125
-
126
-
127
-
128
-
129
-
130
-
131
-
132
-
133
-
134
-
135
-
136
-
137
-
138
-
139
-
140
-
141
-
142
-
143
-
144
-
145
-
146
-
147
-
148
-
149
-
150
-
151
-
152
-
153
-
154
-
155
-
156
-
157
-
158
-
159
-
160
-
161
-
162
-
163
-
164
-
165
-
166
-
167
-
168
-
169
-
170
-
171
-
172
-
173
-
174
-
175
-
176
-
177
-
178
-
179
-
180
-
181
-
182
-
183
-
184
-
185
-
186
-
187
-
188
-
189
-
190
-
191
-
192
-
193
-
194
-
195
-
196
-
197
-
198
-
199
-
200
-
201
-
202
-
203
-
204
-
205
-
206
-
207
-
208
-
209
-
210
-
211
-
212
-
213
-
214
-
215
-
216
-
217
-
218
-
219
-
220
-
221
-
222
-
223
-
224
-
225
-
226
-
227
-
228
-
229
-
230
-
231
-
232
-
233
-
234
-
235
-
236
-
237
-
238
-
239
-
240
-
241
-
242
-
243
-
244
-
245
-
246
-
247
-
248
-
249
-
250
-
251
-
252
-
253
-
254
-
255
-
256
-
257
-
258
-
259
-
260
-
261
-
262
-
263
-
264
-
265
-
266
-
267
-
268
-
269
-
270
-
271
-
272
-
273
-
274
-
275
-
276
 |
 |

57
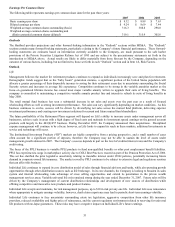
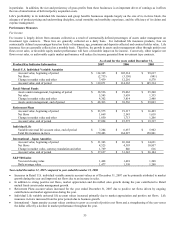
driven by growth in the block of business. The increase in premiums and other considerations for Group Benefits in 2006
compared to 2005 was driven by a sales growth of 11%.
• Fully insured ongoing sales, excluding buyouts, declined in 2007 from 2006 primarily due to fewer large national account sales,
and the small case competitive environment remained intense. The Company also completed a renewal rights arrangement
associated with its medical stop loss business during the second quarter of 2007 eliminating new sales related to this business. In
addition, there was an anticipated decrease in association life sales from an unusually high comparable prior year period. The
increase in 2006 from 2005 was primarily due to strong national account and association life sales.
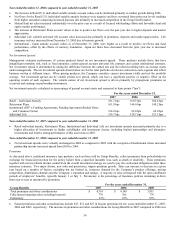
Expenses
There are three major categories for expenses. The first major category of expenses is benefits and losses. These include the costs of
mortality and morbidity, particularly in the group benefits business, and mortality in the individual life businesses, as well as other
contractholder benefits to policyholders. In addition, traditional insurance type products generally use a loss ratio which is expressed as
the amount of benefits incurred during a particular period divided by total premiums and other considerations, as a key indicator of
underwriting performance. Since Group Benefits occasionally buys a block of claims for a stated premium amount, the Company
excludes this buyout from the loss ratio used for evaluating the underwriting results of the business as buyouts may distort the loss ratio.
The second major category is insurance operating costs and expenses, which is commonly expressed in a ratio of a revenue measure
depending on the type of business. The third category is the amortization of deferred policy acquisition costs and the present value of
future profits, which is typically expressed as a percentage of pre-tax income before the cost of this amortization (an approximation of
actual gross profits). The individual annuity business within Retail accounts for the majority of the amortization of deferred policy
acquisition costs and present value of future profits for Life.
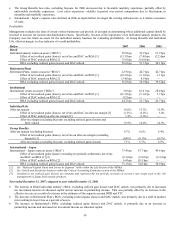
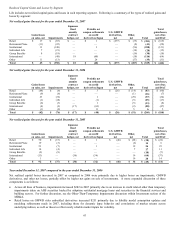
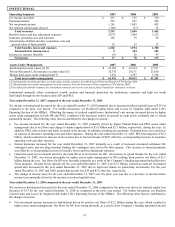
For the years ended December 31,
Retail 2007 2006 2005
General insurance expense ratio (individual annuity) 17.9 bps 17.2 bps 17.9 bps
DAC amortization ratio (individual annuity) 25.5% 65.3% 51.1%
DAC amortization ratio (individual annuity) excluding
DAC unlock [1]
47.9%
52.4%
51.1%
Insurance expenses, net of deferrals $ 1,221 $ 994 $ 867
Individual Life
Death benefits $ 298 $ 251 $ 241
Insurance expenses, net of deferrals $ 193 $ 179 $ 166
Group Benefits
Total benefits and losses $ 3,109 $ 3,002 $ 2,794
Loss ratio (excluding buyout premiums) 72.1% 72.3% 73.1%
Insurance expenses, net of deferrals $ 1,131 $ 1,101 $ 1,022
Expense ratio (excluding buyout premiums) 27.9% 27.6% 27.8%
International - Japan
General insurance expense ratio 48.4 bps 49.1 bps 68.2 bps
DAC amortization ratio 35.3% 30.2% 45.5%
DAC amortization ratio excluding DAC unlock [1] 40.0% 40.7% 45.5%
Insurance expenses, net of deferrals $ 192 $ 160 $ 148
[1] See Unlock and Sensitivity Analysis in the Critical Accounting Estimates section of the MD&A
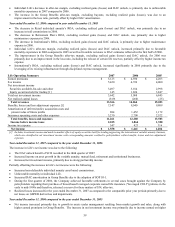
Year ended December 31, 2007 compared to year ended December 31, 2006
• Retail individual annuity general insurance expense ratio increased in 2007 primarily due to higher service and technology costs.
• The Retail DAC amortization ratio (individual annuity) excluding DAC unlock declined in 2007, primarily due to the unlock charge
recorded in 2006. DAC unlock charges generally have the effect of reducing future DAC amortization rates. Retail expects the
DAC amortization ratio to be between 41% and 46% until the next unlock in 2008.
• Retail insurance expenses, net of deferrals, increased due to increasing trail commissions on growing variable annuity assets as well
as increasing non-deferrable commissions on strong mutual fund deposits.
• Individual Life death benefits increased in 2007 primarily due to a larger life insurance in-force and unfavorable mortality.
• Group Benefits expense ratio, excluding buyouts, increased in 2007 primarily due to higher DAC amortization.
• International - Japan general insurance expense ratio declined in 2007 as Japan further leveraged the existing infrastructure as it
attains economies of scale.
Year ended December 31, 2006 compared to year ended December 31, 2005
• Retail individual annuity asset growth in 2006 decreased it’ s expense ratio to a level lower than prior years.
• Individual Life death benefits increased 4% in 2006 primarily due to a larger insurance in-force. Individual Life insurance
expenses, net of deferrals increased 8% for 2006 consistent with the growth of life insurance in-force.