The Hartford 2007 Annual Report Download - page 62
Download and view the complete annual report
Please find page 62 of the 2007 The Hartford annual report below. You can navigate through the pages in the report by either clicking on the pages listed below, or by using the keyword search tool below to find specific information within the annual report.-
 1
1 -
2
-
3
-
4
-
5
-
6
-
7
-
8
-
9
-
10
-
11
-
12
-
13
-
14
-
15
-
16
-
17
-
18
-
19
-
20
-
21
-
22
-
23
-
24
-
25
-
26
-
27
-
28
-
29
-
30
-
31
-
32
-
33
-
34
-
35
-
36
-
37
-
38
-
39
-
40
-
41
-
42
-
43
-
44
-
45
-
46
-
47
-
48
-
49
-
50
-
51
-
 52
52 -
 53
53 -
 54
54 -
 55
55 -
 56
56 -
 57
57 -
 58
58 -
 59
59 -
 60
60 -
 61
61 -
 62
62 -
 63
63 -
 64
64 -
 65
65 -
 66
66 -
 67
67 -
 68
68 -
 69
69 -
 70
70 -
 71
71 -
 72
72 -
73
-
74
-
75
-
76
-
77
-
78
-
79
-
80
-
81
-
82
-
83
-
84
-
85
-
86
-
87
-
88
-
89
-
90
-
91
-
92
-
93
-
94
-
95
-
96
-
97
-
98
-
99
-
100
-
101
-
102
-
103
-
104
-
105
-
106
-
107
-
108
-
109
-
110
-
111
-
112
-
113
-
114
-
115
-
116
-
117
-
118
-
119
-
120
-
121
-
122
-
123
-
124
-
125
-
126
-
127
-
128
-
129
-
130
-
131
-
132
-
133
-
134
-
135
-
136
-
137
-
138
-
139
-
140
-
141
-
142
-
143
-
144
-
145
-
146
-
147
-
148
-
149
-
150
-
151
-
152
-
153
-
154
-
155
-
156
-
157
-
158
-
159
-
160
-
161
-
162
-
163
-
164
-
165
-
166
-
167
-
168
-
169
-
170
-
171
-
172
-
173
-
174
-
175
-
176
-
177
-
178
-
179
-
180
-
181
-
182
-
183
-
184
-
185
-
186
-
187
-
188
-
189
-
190
-
191
-
192
-
193
-
194
-
195
-
196
-
197
-
198
-
199
-
200
-
201
-
202
-
203
-
204
-
205
-
206
-
207
-
208
-
209
-
210
-
211
-
212
-
213
-
214
-
215
-
216
-
217
-
218
-
219
-
220
-
221
-
222
-
223
-
224
-
225
-
226
-
227
-
228
-
229
-
230
-
231
-
232
-
233
-
234
-
235
-
236
-
237
-
238
-
239
-
240
-
241
-
242
-
243
-
244
-
245
-
246
-
247
-
248
-
249
-
250
-
251
-
252
-
253
-
254
-
255
-
256
-
257
-
258
-
259
-
260
-
261
-
262
-
263
-
264
-
265
-
266
-
267
-
268
-
269
-
270
-
271
-
272
-
273
-
274
-
275
-
276
 |
 |
62
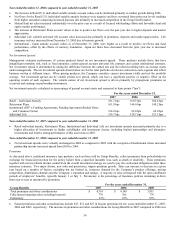
• Across all lines of business, Other net losses increased $156 in 2007 primarily resulted from the change in value of non-qualifying
derivatives due to fluctuations in credit spreads, interest rates, and equity markets. The increase in net losses in 2007 compared to
the prior year was primarily due to changes in value associated with credit derivatives due to credit spreads widening. Credit
spreads widened primarily due to the deterioration in the US housing market, tightened lending conditions, reduction of risk
appetite as well as increased likelihood of a U.S. recession. For further discussion, see the “Capital Market Risk Management”
section of the MD&A.
• The net gains on sales resulted primarily from changes in credit spreads, foreign currency exchanges rates and interest rates from
the date of purchase. For further discussion of gross gains and losses, see “Investment Results” in the Investments section of the
MD&A.
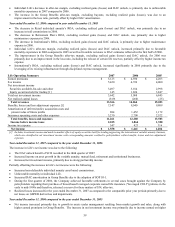
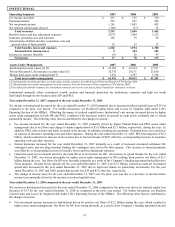
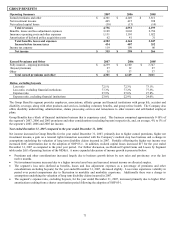
Year ended December 31, 2006 compared to the year ended December 31, 2005
Net realized capital losses increased in 2006 as compared to 2005 primarily as a result of a higher interest rate environment. The
components that drove the increase in net losses during the year ended December 31, 2006 included net losses on sales of fixed maturity
securities, other-than-temporary impairments, periodic net coupon settlements and losses in Other, net, partially offset by a decrease in
losses associated with GMWB derivatives. A more expanded discussion of these components is as follows:
• Retail losses decreased $20 on GMWB derivatives, primarily driven by a more significant impact from liability model refinements
and assumption updates in 2005 as compared to 2006. For further discussion of the GMWB rider valuation assumption, see the
Capital Markets Risk Management section of the MD&A under “Market Risk-Life”.
• International losses on periodic net coupons from currency swaps increased $29 primarily due to increased fixed annuity assets.
• Other net losses were primarily driven from the change in value of non-qualifying derivatives due to fluctuations in interest rates
and foreign currency exchange rates. These losses were partially offset by a pre-tax benefit of $25 received from the WorldCom
security settlement.
• Across all lines of business, other-than-temporary impairments were primarily recorded on corporate fixed maturities. For further
discussion, see the Other-Than-Temporary Impairments section within the Investments section of the MD&A.
• The net losses on sales were derived by fixed maturities for the year ended December 31, 2006 and were primarily the result of
rising interest rates from the date of security purchase and, to a lesser extent, credit spread widening on certain issuers that were
sold. For further discussion of gross gains and losses, see “Investment Results” in the Investments section of the MD&A.
A description of each segment as well as an analysis of the operating results summarized above is included on the following pages.