The Hartford 2007 Annual Report Download - page 140
Download and view the complete annual report
Please find page 140 of the 2007 The Hartford annual report below. You can navigate through the pages in the report by either clicking on the pages listed below, or by using the keyword search tool below to find specific information within the annual report.-
 1
1 -
2
-
3
-
4
-
5
-
6
-
7
-
8
-
9
-
10
-
11
-
12
-
13
-
14
-
15
-
16
-
17
-
18
-
19
-
20
-
21
-
22
-
23
-
24
-
25
-
26
-
27
-
28
-
29
-
30
-
31
-
32
-
33
-
34
-
35
-
36
-
37
-
38
-
39
-
40
-
41
-
42
-
43
-
44
-
45
-
46
-
47
-
48
-
49
-
50
-
51
-
52
-
53
-
54
-
55
-
56
-
57
-
58
-
59
-
60
-
61
-
62
-
63
-
64
-
65
-
66
-
67
-
68
-
69
-
70
-
71
-
72
-
73
-
74
-
75
-
76
-
77
-
78
-
79
-
80
-
81
-
82
-
83
-
84
-
85
-
86
-
87
-
88
-
89
-
90
-
91
-
92
-
93
-
94
-
95
-
96
-
97
-
98
-
99
-
100
-
101
-
102
-
103
-
104
-
105
-
106
-
107
-
108
-
109
-
110
-
111
-
112
-
113
-
114
-
115
-
116
-
117
-
118
-
119
-
120
-
121
-
122
-
123
-
124
-
125
-
126
-
127
-
128
-
129
-
 130
130 -
 131
131 -
 132
132 -
 133
133 -
 134
134 -
 135
135 -
 136
136 -
 137
137 -
 138
138 -
 139
139 -
 140
140 -
 141
141 -
 142
142 -
 143
143 -
 144
144 -
 145
145 -
 146
146 -
 147
147 -
 148
148 -
 149
149 -
 150
150 -
151
-
152
-
153
-
154
-
155
-
156
-
157
-
158
-
159
-
160
-
161
-
162
-
163
-
164
-
165
-
166
-
167
-
168
-
169
-
170
-
171
-
172
-
173
-
174
-
175
-
176
-
177
-
178
-
179
-
180
-
181
-
182
-
183
-
184
-
185
-
186
-
187
-
188
-
189
-
190
-
191
-
192
-
193
-
194
-
195
-
196
-
197
-
198
-
199
-
200
-
201
-
202
-
203
-
204
-
205
-
206
-
207
-
208
-
209
-
210
-
211
-
212
-
213
-
214
-
215
-
216
-
217
-
218
-
219
-
220
-
221
-
222
-
223
-
224
-
225
-
226
-
227
-
228
-
229
-
230
-
231
-
232
-
233
-
234
-
235
-
236
-
237
-
238
-
239
-
240
-
241
-
242
-
243
-
244
-
245
-
246
-
247
-
248
-
249
-
250
-
251
-
252
-
253
-
254
-
255
-
256
-
257
-
258
-
259
-
260
-
261
-
262
-
263
-
264
-
265
-
266
-
267
-
268
-
269
-
270
-
271
-
272
-
273
-
274
-
275
-
276
 |
 |

140
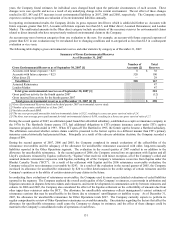
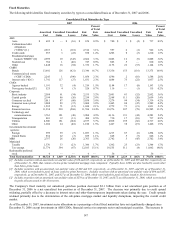
average loss as a percentage of the fixed maturity’ s amortized cost of less than 3%, which, under the Company’ s impairment policy was
deemed to be depressed only to a minor extent.
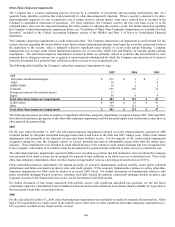
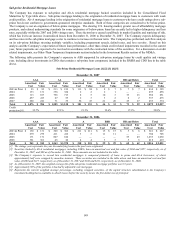
Separate Account Products
Separate account products are those for which a separate investment and liability account is maintained on behalf of the policyholder.
The Company’ s separate accounts reflect accounts wherein the policyholder assumes substantially all the risk and reward. Investment
objectives for separate accounts, which consist of the participants’ account balances, vary by fund account type, as outlined in the
applicable fund prospectus or separate account plan of operations. Separate account products include variable annuities (except those
sold in Japan), variable universal life insurance contracts, 401(k) and variable corporate owned life insurance. The assets and liabilities
associated with variable annuity products sold in Japan do not meet the criteria to be recognized as a separate account because the assets
are not legally insulated from the Company. Therefore, these assets are included with the Company’ s general account assets. As of
December 31, 2007 and 2006, the Company’ s separate accounts totaled $199.9 billion and $180.5 billion, respectively.
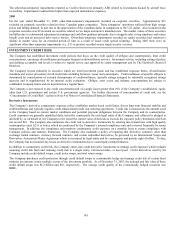
Property & Casualty
The primary investment objective for Property & Casualty’ s Ongoing Operations segment is to maximize economic value while
generating sufficient after-tax income to meet policyholder and corporate obligations. For Property & Casualty’ s Other Operations
segment, the investment objective is to ensure the full and timely payment of all liabilities. Property & Casualty’ s investment strategies
are developed based on a variety of factors including business needs, regulatory requirements and tax considerations.
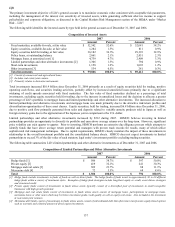
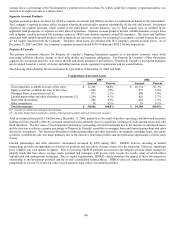
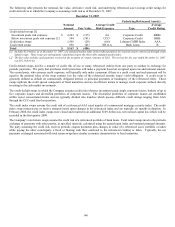
The following table identifies the invested assets by type held as of December 31, 2007 and 2006.
Composition of Invested Assets
2007 2006
Amount Percent
Amount Percent
Fixed maturities, available-for-sale, at fair value $ 27,205 88.8% $ 26,734 91.3%
Equity securities, available-for-sale, at fair value 1,208 3.9% 873 3.0%
Mortgage loans, at amortized cost [1] 671 2.2% 409 1.4%
Limited partnerships and other alternative investments [2] 1,260 4.1% 802 2.7%
Short-term investments 284 0.9% 444 1.5%
Other investments 38 0.1% 38 0.1%
Total investments $ 30,666 100.0% $ 29,300 100.0%
[1] Consist of commercial and agricultural loans.
[2] Includes hedge fund investments outside of limited partnerships and real estate joint ventures.
Total investments increased $1.4 billion since December 31, 2006, primarily as the result of positive operating cash flows and securities
lending activities, partially offset by increased unrealized losses primarily due to a significant widening of credit spreads associated with
fixed maturities. The fair value of fixed maturities declined as a percentage of total investments due to the increase in unrealized losses
and the decision to allocate a greater percentage of Property & Casualty’ s portfolio to mortgage loans and limited partnerships and other
alternative investments. The increased allocation to limited partnerships and other alternative investments, mortgage loans, and equity
securities, available-for-sale was made primarily due to the attractive risk/return profiles and diversification opportunities of these asset
classes.
Limited partnerships and other alternative investments increased by $458 during 2007. HIMCO believes investing in limited
partnerships provides an opportunity to diversify its portfolio and earn above average returns over the long-term. However, significant
price volatility can exist quarter to quarter. Prior to investing, HIMCO performs an extensive due diligence process which attempts to
identify funds that have above average return potential and managers with proven track records for results, many of which utilize
sophisticated risk management techniques. Due to capital requirements, HIMCO closely monitors the impact of these investments in
relationship to the investment portfolio and the overall consolidated balance sheets. HIMCO does not expect investments in limited
partnerships to exceed 3% of the fair value of each statutory legal entity’ s investment portfolio.