The Hartford 2007 Annual Report Download - page 158
Download and view the complete annual report
Please find page 158 of the 2007 The Hartford annual report below. You can navigate through the pages in the report by either clicking on the pages listed below, or by using the keyword search tool below to find specific information within the annual report.-
 1
1 -
2
-
3
-
4
-
5
-
6
-
7
-
8
-
9
-
10
-
11
-
12
-
13
-
14
-
15
-
16
-
17
-
18
-
19
-
20
-
21
-
22
-
23
-
24
-
25
-
26
-
27
-
28
-
29
-
30
-
31
-
32
-
33
-
34
-
35
-
36
-
37
-
38
-
39
-
40
-
41
-
42
-
43
-
44
-
45
-
46
-
47
-
48
-
49
-
50
-
51
-
52
-
53
-
54
-
55
-
56
-
57
-
58
-
59
-
60
-
61
-
62
-
63
-
64
-
65
-
66
-
67
-
68
-
69
-
70
-
71
-
72
-
73
-
74
-
75
-
76
-
77
-
78
-
79
-
80
-
81
-
82
-
83
-
84
-
85
-
86
-
87
-
88
-
89
-
90
-
91
-
92
-
93
-
94
-
95
-
96
-
97
-
98
-
99
-
100
-
101
-
102
-
103
-
104
-
105
-
106
-
107
-
108
-
109
-
110
-
111
-
112
-
113
-
114
-
115
-
116
-
117
-
118
-
119
-
120
-
121
-
122
-
123
-
124
-
125
-
126
-
127
-
128
-
129
-
130
-
131
-
132
-
133
-
134
-
135
-
136
-
137
-
138
-
139
-
140
-
141
-
142
-
143
-
144
-
145
-
146
-
147
-
 148
148 -
 149
149 -
 150
150 -
 151
151 -
 152
152 -
 153
153 -
 154
154 -
 155
155 -
 156
156 -
 157
157 -
 158
158 -
 159
159 -
 160
160 -
 161
161 -
 162
162 -
 163
163 -
 164
164 -
 165
165 -
 166
166 -
 167
167 -
 168
168 -
169
-
170
-
171
-
172
-
173
-
174
-
175
-
176
-
177
-
178
-
179
-
180
-
181
-
182
-
183
-
184
-
185
-
186
-
187
-
188
-
189
-
190
-
191
-
192
-
193
-
194
-
195
-
196
-
197
-
198
-
199
-
200
-
201
-
202
-
203
-
204
-
205
-
206
-
207
-
208
-
209
-
210
-
211
-
212
-
213
-
214
-
215
-
216
-
217
-
218
-
219
-
220
-
221
-
222
-
223
-
224
-
225
-
226
-
227
-
228
-
229
-
230
-
231
-
232
-
233
-
234
-
235
-
236
-
237
-
238
-
239
-
240
-
241
-
242
-
243
-
244
-
245
-
246
-
247
-
248
-
249
-
250
-
251
-
252
-
253
-
254
-
255
-
256
-
257
-
258
-
259
-
260
-
261
-
262
-
263
-
264
-
265
-
266
-
267
-
268
-
269
-
270
-
271
-
272
-
273
-
274
-
275
-
276
 |
 |

158
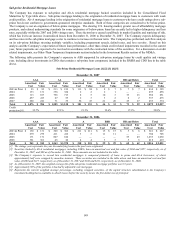
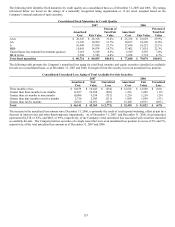
While interest rate risk associated with many of these products has been reduced through the use of market value adjustment features
and surrender charges, the primary risk associated with these products is that the spread between investment return and credited rate
may not be sufficient to earn targeted returns.
The Company also manages the risk of certain insurance liabilities similarly to investment type products due to the relative
predictability of the aggregate cash flow payment streams. Products in this category may contain significant actuarial (including
mortality and morbidity) pricing and cash flow risks. Product examples include structured settlement contracts, on-benefit annuities
(i.e., the annuitant is currently receiving benefits thereon) and short-term and long-term disability contracts. The cash outflows
associated with these policy liabilities are not interest rate sensitive but do vary based on the timing and amount of benefit payments.
The primary risks associated with these products are that the benefits will exceed expected actuarial pricing and/or that the actual timing
of the cash flows will differ from those anticipated, resulting in an investment return lower than that assumed in pricing. Average
contract duration can range from less than one year to typically up to fifteen years.
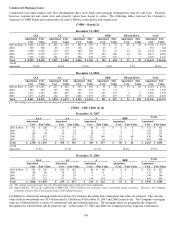
Derivatives
Life utilizes a variety of derivative instruments to mitigate interest rate risk. Interest rate swaps are primarily used to convert interest
receipts or payments to a fixed or variable rate. The use of such swaps enables the Company to customize contract terms and conditions
to customer objectives and satisfies the operation’s asset/liability duration matching policy. Occasionally, swaps are also used to hedge
the variability in the cash flow of a forecasted purchase or sale due to changes in interest rates.
Interest rate caps and floors, swaptions and option contracts are primarily used to hedge against the risk of liability contract holder
disintermediation in a rising interest rate environment, and to offset the changes in fair value of corresponding derivatives embedded in
certain of the Company’ s fixed maturity investments. Interest rate caps are also used to manage the duration risk in certain portfolios.
At December 31, 2007 and 2006, notional amounts pertaining to derivatives utilized to manage interest rate risk totaled $16.8 billion
and $15.6 billion, respectively ($13.1 billion and $11.4 billion, respectively, related to investments and $3.7 billion and $4.2 billion,
respectively, related to life liabilities). The fair value of these derivatives was $45 and $(42) as of December 31, 2007 and 2006,
respectively.
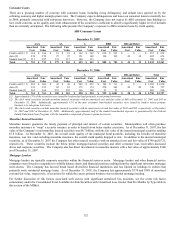
Calculated Interest Rate Sensitivity
The after-tax change in the net economic value of investment contracts (e.g., guaranteed investment contracts) and certain insurance
product liabilities (e.g., short-term and long-term disability contracts), for which the payment rates are fixed at contract issuance and the
investment experience is substantially absorbed by Life, are included in the following table along with the corresponding invested
assets. Also included in this analysis are the interest rate sensitive derivatives used by Life to hedge its exposure to interest rate risk.
Certain financial instruments, such as limited partnerships, have been omitted from the analysis due to the fact that the investments are
accounted for under the equity method and generally lack sensitivity to interest rate changes. Separate account assets and liabilities and
equity securities held for trading and the corresponding liabilities associated with the variable annuity products sold in Japan are
excluded from the analysis because gains and losses in separate accounts accrue to policyholders. The calculation of the estimated
hypothetical change in net economic value below assumes a 100 basis point upward and downward parallel shift in the yield curve.
Change in Net Economic Value As of December 31,
2007 2006
Basis point shift - 100 + 100 - 100 + 100
Amount $ (160) $ 60 $ 1 $ (33)
The fixed liabilities included above represented approximately 45% and 46% of Life’ s general account liabilities as of December 31,
2007 and 2006, respectively. The assets supporting the fixed liabilities are monitored and managed within rigorous duration guidelines
using scenario simulation techniques, and are evaluated on an annual basis, in compliance with regulatory requirements.
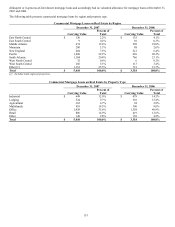
The after-tax change in fair value of the invested asset portfolios that support certain universal life-type contracts and other insurance
contracts are shown in the following table. The cash flows associated with these liabilities are less predictable than fixed liabilities. The
Company identifies the most appropriate investment strategy based upon the expected policyholder behavior and liability crediting
needs. The calculation of the estimated hypothetical change in fair value below assumes a 100 basis point upward and downward
parallel shift in the yield curve.
Change in Fair Value As of December 31,
2007 2006
Basis point shift - 100 + 100 - 100 + 100
Amount $ 375 $ (364) $ 422 $ (415)
The selection of the 100 basis point parallel shift in the yield curve was made only as an illustration of the potential hypothetical impact
of such an event and should not be construed as a prediction of future market events. Actual results could differ materially from those
illustrated above due to the nature of the estimates and assumptions used in the above analysis. The Company’ s sensitivity analysis
calculation assumes that the composition of invested assets and liabilities remain materially consistent throughout the year and that the