The Hartford 2007 Annual Report Download - page 215
Download and view the complete annual report
Please find page 215 of the 2007 The Hartford annual report below. You can navigate through the pages in the report by either clicking on the pages listed below, or by using the keyword search tool below to find specific information within the annual report.-
 1
1 -
2
-
3
-
4
-
5
-
6
-
7
-
8
-
9
-
10
-
11
-
12
-
13
-
14
-
15
-
16
-
17
-
18
-
19
-
20
-
21
-
22
-
23
-
24
-
25
-
26
-
27
-
28
-
29
-
30
-
31
-
32
-
33
-
34
-
35
-
36
-
37
-
38
-
39
-
40
-
41
-
42
-
43
-
44
-
45
-
46
-
47
-
48
-
49
-
50
-
51
-
52
-
53
-
54
-
55
-
56
-
57
-
58
-
59
-
60
-
61
-
62
-
63
-
64
-
65
-
66
-
67
-
68
-
69
-
70
-
71
-
72
-
73
-
74
-
75
-
76
-
77
-
78
-
79
-
80
-
81
-
82
-
83
-
84
-
85
-
86
-
87
-
88
-
89
-
90
-
91
-
92
-
93
-
94
-
95
-
96
-
97
-
98
-
99
-
100
-
101
-
102
-
103
-
104
-
105
-
106
-
107
-
108
-
109
-
110
-
111
-
112
-
113
-
114
-
115
-
116
-
117
-
118
-
119
-
120
-
121
-
122
-
123
-
124
-
125
-
126
-
127
-
128
-
129
-
130
-
131
-
132
-
133
-
134
-
135
-
136
-
137
-
138
-
139
-
140
-
141
-
142
-
143
-
144
-
145
-
146
-
147
-
148
-
149
-
150
-
151
-
152
-
153
-
154
-
155
-
156
-
157
-
158
-
159
-
160
-
161
-
162
-
163
-
164
-
165
-
166
-
167
-
168
-
169
-
170
-
171
-
172
-
173
-
174
-
175
-
176
-
177
-
178
-
179
-
180
-
181
-
182
-
183
-
184
-
185
-
186
-
187
-
188
-
189
-
190
-
191
-
192
-
193
-
194
-
195
-
196
-
197
-
198
-
199
-
200
-
201
-
202
-
203
-
204
-
 205
205 -
 206
206 -
 207
207 -
 208
208 -
 209
209 -
 210
210 -
 211
211 -
 212
212 -
 213
213 -
 214
214 -
 215
215 -
 216
216 -
 217
217 -
 218
218 -
 219
219 -
 220
220 -
 221
221 -
 222
222 -
 223
223 -
 224
224 -
 225
225 -
226
-
227
-
228
-
229
-
230
-
231
-
232
-
233
-
234
-
235
-
236
-
237
-
238
-
239
-
240
-
241
-
242
-
243
-
244
-
245
-
246
-
247
-
248
-
249
-
250
-
251
-
252
-
253
-
254
-
255
-
256
-
257
-
258
-
259
-
260
-
261
-
262
-
263
-
264
-
265
-
266
-
267
-
268
-
269
-
270
-
271
-
272
-
273
-
274
-
275
-
276
 |
 |
THE HARTFORD FINANCIAL SERVICES GROUP, INC.
NOTES TO CONSOLIDATED FINANCIAL STATEMENTS (continued)
F-38
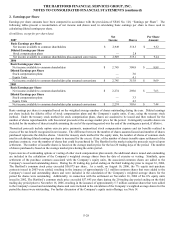
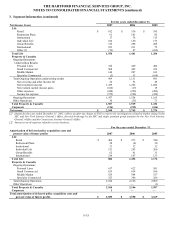
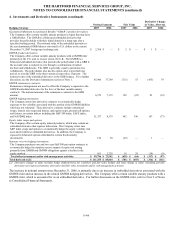
4. Investments and Derivative Instruments (continued)
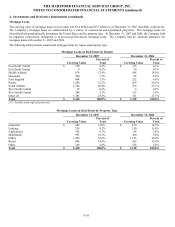
As of December 31, 2007, fixed maturities, comprised of approximately 4,330 securities, accounted for approximately 92% of the
Company’ s total unrealized loss amount. The remaining 8% primarily consisted of non-redeemable preferred stock in the financial
services sector, the majority of which were in an unrealized loss position for less than six months. Other-than-temporary impairments
for certain ABS and CMBS are recognized if the fair value of the security, as determined by external pricing sources, is less than its
cost or amortized cost and there has been a decrease in the present value of the expected cash flows since the last reporting period.
Based on management’ s best estimate of future cash flows, there were no such ABS and CMBS in an unrealized loss position as of
December 31, 2007 that were deemed to be other-than-temporarily impaired.
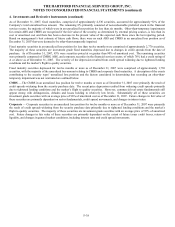
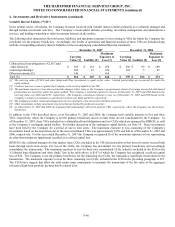
Fixed maturity securities in an unrealized loss position for less than twelve months were comprised of approximately 2,770 securities.
The majority of these securities are investment grade fixed maturities depressed due to changes in credit spreads from the date of
purchase. As of December 31, 2007, 83% were securities priced at or greater than 90% of amortized cost. The remaining securities
were primarily composed of CMBS, ABS, and corporate securities in the financial services sector, of which 76% had a credit rating of
A or above as of December 31, 2007. The severity of the depression resulted from credit spread widening due to tightened lending
conditions and the market’ s flight to quality securities.
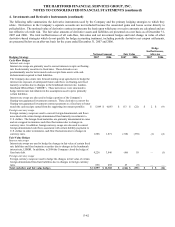
Fixed maturity securities depressed for twelve months or more as of December 31, 2007 were comprised of approximately 1,730
securities, with the majority of the unrealized loss amount relating to CMBS and corporate fixed maturities. A description of the events
contributing to the security types’ unrealized loss position and the factors considered in determining that recording an other-than-
temporary impairment was not warranted are outlined below.
CMBS — The CMBS in an unrealized loss position for twelve months or more as of December 31, 2007 were primarily the result of
credit spreads widening from the security purchase date. The recent price depression resulted from widening credit spreads primarily
due to tightened lending conditions and the market’ s flight to quality securities. However, commercial real estate fundamentals still
appear strong with delinquencies, defaults and losses holding to relatively low levels. Substantially all of these securities are
investment grade securities with an average price of 96% of amortized cost as of December 31, 2007. Future changes in fair value of
these securities are primarily dependent on sector fundamentals, credit spread movements, and changes in interest rates.
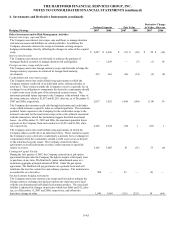
Corporate — Corporate securities in an unrealized loss position for twelve months or more as of December 31, 2007 were primarily
the result of credit spreads widening from the security purchase date primarily due to tightened lending conditions and the market’ s
flight to quality securities. The majority of these securities are investment grade securities with an average price of 95% of amortized
cost. Future changes in fair value of these securities are primarily dependent on the extent of future issuer credit losses, return of
liquidity, and changes in general market conditions, including interest rates and credit spread movements.