The Hartford 2007 Annual Report Download - page 45
Download and view the complete annual report
Please find page 45 of the 2007 The Hartford annual report below. You can navigate through the pages in the report by either clicking on the pages listed below, or by using the keyword search tool below to find specific information within the annual report.-
 1
1 -
2
-
3
-
4
-
5
-
6
-
7
-
8
-
9
-
10
-
11
-
12
-
13
-
14
-
15
-
16
-
17
-
18
-
19
-
20
-
21
-
22
-
23
-
24
-
25
-
26
-
27
-
28
-
29
-
30
-
31
-
32
-
33
-
34
-
 35
35 -
 36
36 -
 37
37 -
 38
38 -
 39
39 -
 40
40 -
 41
41 -
 42
42 -
 43
43 -
 44
44 -
 45
45 -
 46
46 -
 47
47 -
 48
48 -
 49
49 -
 50
50 -
 51
51 -
 52
52 -
 53
53 -
 54
54 -
 55
55 -
56
-
57
-
58
-
59
-
60
-
61
-
62
-
63
-
64
-
65
-
66
-
67
-
68
-
69
-
70
-
71
-
72
-
73
-
74
-
75
-
76
-
77
-
78
-
79
-
80
-
81
-
82
-
83
-
84
-
85
-
86
-
87
-
88
-
89
-
90
-
91
-
92
-
93
-
94
-
95
-
96
-
97
-
98
-
99
-
100
-
101
-
102
-
103
-
104
-
105
-
106
-
107
-
108
-
109
-
110
-
111
-
112
-
113
-
114
-
115
-
116
-
117
-
118
-
119
-
120
-
121
-
122
-
123
-
124
-
125
-
126
-
127
-
128
-
129
-
130
-
131
-
132
-
133
-
134
-
135
-
136
-
137
-
138
-
139
-
140
-
141
-
142
-
143
-
144
-
145
-
146
-
147
-
148
-
149
-
150
-
151
-
152
-
153
-
154
-
155
-
156
-
157
-
158
-
159
-
160
-
161
-
162
-
163
-
164
-
165
-
166
-
167
-
168
-
169
-
170
-
171
-
172
-
173
-
174
-
175
-
176
-
177
-
178
-
179
-
180
-
181
-
182
-
183
-
184
-
185
-
186
-
187
-
188
-
189
-
190
-
191
-
192
-
193
-
194
-
195
-
196
-
197
-
198
-
199
-
200
-
201
-
202
-
203
-
204
-
205
-
206
-
207
-
208
-
209
-
210
-
211
-
212
-
213
-
214
-
215
-
216
-
217
-
218
-
219
-
220
-
221
-
222
-
223
-
224
-
225
-
226
-
227
-
228
-
229
-
230
-
231
-
232
-
233
-
234
-
235
-
236
-
237
-
238
-
239
-
240
-
241
-
242
-
243
-
244
-
245
-
246
-
247
-
248
-
249
-
250
-
251
-
252
-
253
-
254
-
255
-
256
-
257
-
258
-
259
-
260
-
261
-
262
-
263
-
264
-
265
-
266
-
267
-
268
-
269
-
270
-
271
-
272
-
273
-
274
-
275
-
276
 |
 |

45
Valuation of Fixed Maturities
The fair value for fixed maturity securities is largely determined by one of three primary pricing methods: third party pricing service
market prices, independent broker quotations or pricing matrices. Security pricing is applied using a hierarchy or “waterfall” approach
whereby prices are first sought from third party pricing services with the remaining unpriced securities submitted to independent brokers
for prices or lastly priced via a pricing matrix. Typical inputs used by these three pricing methods include, but are not limited to,
reported trades, benchmark yields, issuer spreads, bids, offers, and/or estimated cash flows and prepayments speeds. Based on the
typical trading volumes and the lack of quoted market prices for fixed maturities, third party pricing services will normally derive the
security prices through recent reported trades for identical or similar securities making adjustments through the reporting date based
upon available market observable information as outlined above. If there are no recent reported trades, the third party pricing services
and brokers may use matrix or model processes to develop a security price where future cash flow expectations are developed based
upon collateral performance and discounted at an estimated market rate. Included in the asset-backed securities (“ABS”), collaterized
mortgage obligations (“CMOs”), and mortgage-backed securities (“MBS”) pricing are estimates of the rate of future prepayments of
principal over the remaining life of the securities. Such estimates are derived based on the characteristics of the underlying structure and
prepayment speeds previously experienced at the interest rate levels projected for the underlying collateral. Actual prepayment
experience may vary from these estimates.
Prices from third party pricing services are often unavailable for securities that are rarely traded or are traded only in privately
negotiated transactions. As a result, certain of the Company’ s securities are priced via independent broker quotations which utilize
inputs that may be difficult to corroborate with observable market based data. A pricing matrix is used to price securities for which the
Company is unable to obtain either a price from a third party pricing service or an independent broker quotation. The pricing matrix
begins with current spread levels to determine the market price for the security. The credit spreads, as assigned by a nationally
recognized rating agency, incorporate the issuer’ s credit rating and a risk premium, if warranted, due to the issuer’ s industry and the
security’ s time to maturity. The issuer-specific yield adjustments, which can be positive or negative, are updated twice annually, as of
June 30 and December 31, by an independent third party source and are intended to adjust security prices for issuer-specific factors.
The matrix-priced securities at December 31, 2007 and 2006 primarily consisted of non-144A private placements and have an average
duration of 4.7 and 5.1 years, respectively. The Company assigns a credit rating to these securities based upon an internal analysis of
the issuer’ s financial strength.
The Company performs a monthly analysis on the prices received from third parties to assess if the prices represent a reasonable
estimate of the fair value. This process involves quantitative and qualitative analysis and is overseen by investment and accounting
professionals. Examples of procedures performed include, but are not limited to, initial and on-going review of third party pricing
services methodologies, review of pricing statistics and trends, back testing recent trades, and monitoring of trading volumes. As a
result of this analysis, if the Company determines there is a more appropriate fair value based upon available market data, the price
received from the third party is adjusted accordingly.
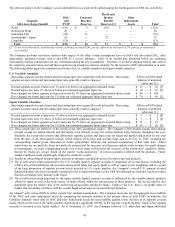
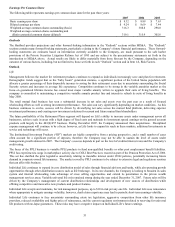
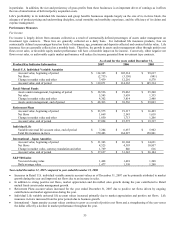
The following table presents the fair value of fixed maturity securities by pricing source as of December 31, 2007 and 2006.
2007 2006
Fair Value
Percentage
of Total
Fair Value
Fair Value
Percentage
of Total
Fair Value
Priced via third party pricing services $ 66,771 83.4% $ 69,023 87.3%
Priced via independent broker quotations 7,561 9.4% 4,309 5.4%
Priced via matrices 5,426 6.8% 5,605 7.1%
Priced via other methods 297 0.4% 137 0.2%
Total $ 80,055 100.0% $ 79,074 100.0%
The fair value of a financial instrument is the amount at which the instrument could be exchanged in a current transaction between
knowledgeable, unrelated willing parties using inputs, including assumptions and estimates, a market participant would utilize. As such,
the estimated fair value of a financial instrument may differ significantly from the amount that could be realized if the security was sold
immediately.