The Hartford 2007 Annual Report Download - page 67
Download and view the complete annual report
Please find page 67 of the 2007 The Hartford annual report below. You can navigate through the pages in the report by either clicking on the pages listed below, or by using the keyword search tool below to find specific information within the annual report.-
 1
1 -
2
-
3
-
4
-
5
-
6
-
7
-
8
-
9
-
10
-
11
-
12
-
13
-
14
-
15
-
16
-
17
-
18
-
19
-
20
-
21
-
22
-
23
-
24
-
25
-
26
-
27
-
28
-
29
-
30
-
31
-
32
-
33
-
34
-
35
-
36
-
37
-
38
-
39
-
40
-
41
-
42
-
43
-
44
-
45
-
46
-
47
-
48
-
49
-
50
-
51
-
52
-
53
-
54
-
55
-
56
-
 57
57 -
 58
58 -
 59
59 -
 60
60 -
 61
61 -
 62
62 -
 63
63 -
 64
64 -
 65
65 -
 66
66 -
 67
67 -
 68
68 -
 69
69 -
 70
70 -
 71
71 -
 72
72 -
 73
73 -
 74
74 -
 75
75 -
 76
76 -
 77
77 -
78
-
79
-
80
-
81
-
82
-
83
-
84
-
85
-
86
-
87
-
88
-
89
-
90
-
91
-
92
-
93
-
94
-
95
-
96
-
97
-
98
-
99
-
100
-
101
-
102
-
103
-
104
-
105
-
106
-
107
-
108
-
109
-
110
-
111
-
112
-
113
-
114
-
115
-
116
-
117
-
118
-
119
-
120
-
121
-
122
-
123
-
124
-
125
-
126
-
127
-
128
-
129
-
130
-
131
-
132
-
133
-
134
-
135
-
136
-
137
-
138
-
139
-
140
-
141
-
142
-
143
-
144
-
145
-
146
-
147
-
148
-
149
-
150
-
151
-
152
-
153
-
154
-
155
-
156
-
157
-
158
-
159
-
160
-
161
-
162
-
163
-
164
-
165
-
166
-
167
-
168
-
169
-
170
-
171
-
172
-
173
-
174
-
175
-
176
-
177
-
178
-
179
-
180
-
181
-
182
-
183
-
184
-
185
-
186
-
187
-
188
-
189
-
190
-
191
-
192
-
193
-
194
-
195
-
196
-
197
-
198
-
199
-
200
-
201
-
202
-
203
-
204
-
205
-
206
-
207
-
208
-
209
-
210
-
211
-
212
-
213
-
214
-
215
-
216
-
217
-
218
-
219
-
220
-
221
-
222
-
223
-
224
-
225
-
226
-
227
-
228
-
229
-
230
-
231
-
232
-
233
-
234
-
235
-
236
-
237
-
238
-
239
-
240
-
241
-
242
-
243
-
244
-
245
-
246
-
247
-
248
-
249
-
250
-
251
-
252
-
253
-
254
-
255
-
256
-
257
-
258
-
259
-
260
-
261
-
262
-
263
-
264
-
265
-
266
-
267
-
268
-
269
-
270
-
271
-
272
-
273
-
274
-
275
-
276
 |
 |

67
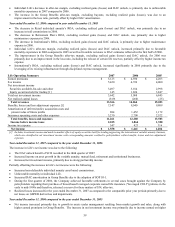
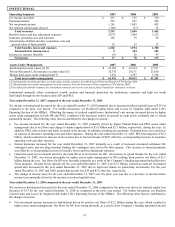
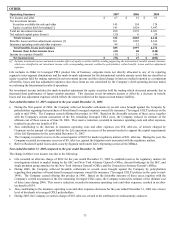
INSTITUTIONAL
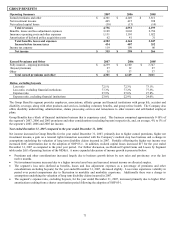
Operating Summary 2007 2006 2005
Fee income and other $251 $ 125 $120
Earned premiums 987 607 504
Net investment income 1,241 1,003 802
Net realized capital gains (losses) (188) (37) 36
Total revenues 2,291 1,698 1,462
Benefits, losses and loss adjustment expenses 2,074 1,484 1,212
Insurance operating costs and expenses 185 78 56
Amortization of deferred policy acquisition costs and
present value of future profits
23
32
32
Total benefits, losses and expenses 2,282 1,594 1,300
Income before income taxes 9 104 162
Income tax expense (benefit) (8) 26 47
Net income $17 $ 78 $115
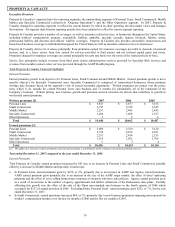
Assets Under Management
2007
2006
2005
Institutional account values [1] [3] $ 25,103 $ 22,214 $ 17,917
Private Placement Life Insurance account values [3] 32,792 26,131 23,836
Mutual fund assets under management [2] 3,581 2,567 1,528
Total assets under management $ 61,476 $ 50,912 $ 43,281
[1] Institutional investment product account values include transfers from Retirement Plans and Retail of $763 during 2006.
[2] Mutual fund assets under management include transfers from the Retirement Plans segment of $178 during 2006.
[3] Includes policyholder balances for investment contracts and reserves for future policy benefits for insurance contracts.
Institutional primarily offers customized wealth creation and financial protection for institutions, corporate and high net worth
individuals through its two business units: IIP and PPLI.
Year ended December 31, 2007 compared to the year ended December 31, 2006
Net income in Institutional decreased for the year ended December 31, 2007 primarily due to increased realized capital losses of $151 as
compared to the prior year period. For further discussion, see Realized Capital Gains and Losses by Segment table under Life’ s
Operating Section of the MD&A. Offsetting the impact of realized capital losses, Institutional’ s net income increased driven by higher
assets under management in both IIP and PPLI, combined with increased returns on general account assets, primarily due to strong
partnership income. The following other factors contributed to the changes in income:
• Fee income increased for the year ended December 31, 2007 primarily driven by higher Mutual Fund and PPLI assets under
management due to net flows and change in market appreciation of $5.8 billion and $2.1 billion, respectively, during the year. In
addition, PPLI collects front-end loads, recorded in fee income, to subsidize premium tax payments. Premium taxes are recorded as
an expense in insurance operating costs and other expenses. During the year ended December 31, 2007, PPLI had deposits of $5.2
billion, which resulted in an increase in fee income due to front-end loads of $107 offset by a corresponding increase in insurance
operating costs and other expenses.
• Earned premiums increased for the year ended December 31, 2007 primarily as a result of increased structured settlement life
contingent sales, and one large terminal funding life contingent case sold in the third quarter. This increase in earned premiums
was offset by a corresponding increase in benefits, losses and loss adjustment expenses.
• General account net investment spread is the main driver of net income for IIP. An increase in spread income for the year ended
December 31, 2007, was driven principally by higher assets under management in IIP resulting from positive net flows of $1.5
billion during the year. Net flows for IIP were favorable primarily as a result of the Company’ s funding agreement backed Investor
Notes program. Investor Notes deposits for the year ended December 31, 2007 were $1.5 billion. General account net investment
spread also increased for the year ended December 31, 2007 due to improved returns on partnership investments. For the year
ended December 31, 2007 and 2006, partnership income was $32 and $15, after-tax, respectively.
• The change in income taxes for the year ended December 31, 2007 over the prior year was due to a decrease in income before
income taxes primarily driven by the increase in realized capital losses.
Year ended December 31, 2006 compared to the year ended December 31, 2005
Net income in Institutional decreased for the year ended December 31, 2006 compared to the prior year driven by realized capital loss
increases of $73 for the year ended December 31, 2006 as compared to the prior year period. For further discussion, see Realized
Capital Gains and Losses by Segment table under Life’ s Operating Section of the MD&A. The following other factors contributed to
the changes in income:
• Net investment income increased in Institutional driven by positive net flows of $2.2 billion during the year, which resulted in
higher assets under management. Net flows for IIP were strong primarily as a result of the Company’ s funding agreement backed