The Hartford 2007 Annual Report Download - page 231
Download and view the complete annual report
Please find page 231 of the 2007 The Hartford annual report below. You can navigate through the pages in the report by either clicking on the pages listed below, or by using the keyword search tool below to find specific information within the annual report.-
 1
1 -
2
-
3
-
4
-
5
-
6
-
7
-
8
-
9
-
10
-
11
-
12
-
13
-
14
-
15
-
16
-
17
-
18
-
19
-
20
-
21
-
22
-
23
-
24
-
25
-
26
-
27
-
28
-
29
-
30
-
31
-
32
-
33
-
34
-
35
-
36
-
37
-
38
-
39
-
40
-
41
-
42
-
43
-
44
-
45
-
46
-
47
-
48
-
49
-
50
-
51
-
52
-
53
-
54
-
55
-
56
-
57
-
58
-
59
-
60
-
61
-
62
-
63
-
64
-
65
-
66
-
67
-
68
-
69
-
70
-
71
-
72
-
73
-
74
-
75
-
76
-
77
-
78
-
79
-
80
-
81
-
82
-
83
-
84
-
85
-
86
-
87
-
88
-
89
-
90
-
91
-
92
-
93
-
94
-
95
-
96
-
97
-
98
-
99
-
100
-
101
-
102
-
103
-
104
-
105
-
106
-
107
-
108
-
109
-
110
-
111
-
112
-
113
-
114
-
115
-
116
-
117
-
118
-
119
-
120
-
121
-
122
-
123
-
124
-
125
-
126
-
127
-
128
-
129
-
130
-
131
-
132
-
133
-
134
-
135
-
136
-
137
-
138
-
139
-
140
-
141
-
142
-
143
-
144
-
145
-
146
-
147
-
148
-
149
-
150
-
151
-
152
-
153
-
154
-
155
-
156
-
157
-
158
-
159
-
160
-
161
-
162
-
163
-
164
-
165
-
166
-
167
-
168
-
169
-
170
-
171
-
172
-
173
-
174
-
175
-
176
-
177
-
178
-
179
-
180
-
181
-
182
-
183
-
184
-
185
-
186
-
187
-
188
-
189
-
190
-
191
-
192
-
193
-
194
-
195
-
196
-
197
-
198
-
199
-
200
-
201
-
202
-
203
-
204
-
205
-
206
-
207
-
208
-
209
-
210
-
211
-
212
-
213
-
214
-
215
-
216
-
217
-
218
-
219
-
220
-
 221
221 -
 222
222 -
 223
223 -
 224
224 -
 225
225 -
 226
226 -
 227
227 -
 228
228 -
 229
229 -
 230
230 -
 231
231 -
 232
232 -
 233
233 -
 234
234 -
 235
235 -
 236
236 -
 237
237 -
 238
238 -
 239
239 -
 240
240 -
 241
241 -
242
-
243
-
244
-
245
-
246
-
247
-
248
-
249
-
250
-
251
-
252
-
253
-
254
-
255
-
256
-
257
-
258
-
259
-
260
-
261
-
262
-
263
-
264
-
265
-
266
-
267
-
268
-
269
-
270
-
271
-
272
-
273
-
274
-
275
-
276
 |
 |

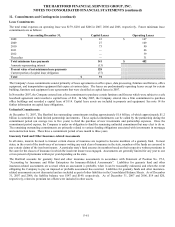
THE HARTFORD FINANCIAL SERVICES GROUP, INC.
NOTES TO CONSOLIDATED FINANCIAL STATEMENTS (continued)
F-54
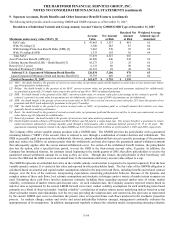
9. Separate Accounts, Death Benefits and Other Insurance Benefit Features (continued)
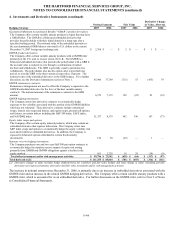
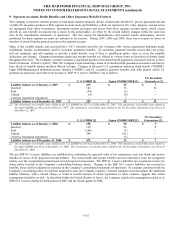
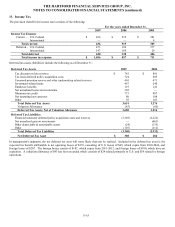
The following table provides details concerning GMDB and GMIB exposure as of December 31, 2007:
Breakdown of Individual Variable and Group Annuity Account Value by GMDB/GMIB Type at December 31, 2007
Maximum anniversary value (MAV) [1]
Account
Value
Net Amount
at Risk
Retained Net
Amount
at Risk
Wei
g
hted Avera
g
e
Attained Age of
Annuitant
MAV only $ 47,463 $ 3,557 $ 419 65
With 5% rollup [2] 3,360 285 67 64
With Earnings Protection Benefit Rider (EPB) [3] 5,463 530 85 62
With 5% rollup & EPB 1,333 155 30 64
Total MAV 57,619 4,527 601
Asset Protection Benefit (APB) [4] 42,489 446 242 62
Lifetime Income Benefit (LIB) - Death Benefit [5] 10,273 25 25 62
Reset [6] (5-7 years) 6,132 80 80 66
Return of Premium [7] /Other 10,321 28 28 54
Subtotal U.S. Guaranteed Minimum Death Benefits 126,834 5,106 976 63
Japan Guaranteed Minimum Death and Income Benefit [8] 35,793 649 419 66
Total at December 31, 2007 $ 162,627 $ 5,755 $ 1,395
[1] MAV: the death benefit is the greatest of current account value, net premiums paid and the highest account value on any anniversary before
age 80 (adjusted for withdrawals).
[2] Rollup: the death benefit is the greatest of the MAV, current account value, net premium paid and premiums (adjusted for withdrawals)
accumulated at generally 5% simple interest up to the earlier of age 80 or 100% of adjusted premiums.
[3] EPB: the death benefit is the greatest of the MAV, current account value, or contract value plus a percentage of the contract’s growth. The
contract’s growth is account value less premiums net of withdrawals, subject to a cap of 200% of premiums net of withdrawals.
[4] APB: the death benefit is the greater of current account value or MAV, not to exceed current account value plus 25% times the greater of net
premiums and MAV (each adjusted for premiums in the past 12 months).
[5] LIB: the death benefit is the greatest of current account value or MAV, net premiums paid, or a benefit amount that ratchets over time,
generally based on market performance.
[6] Reset: the death benefit is the greatest of current account value, net premiums paid and the most recent five to seven year anniversary account
value before age 80 (adjusted for withdrawals).
[7] Return of premium: the death benefit is the greater of current account value and net premiums paid.
[8] Death benefits include a Return of Premium and MAV (before age 80) paid in a single lump sum. The income benefit is a guarantee to return
initial investment, adjusted for earnings liquidity, paid through a fixed annuity, after a minimum deferral period of 10, 15 or 20 years. The
guaranteed remaining balance related to the Japan GMIB was $26.8 billion and $22.6 billion as of December31, 2007 and 2006, respectively.
The Company offers certain variable annuity products with a GMWB rider. The GMWB provides the policyholder with a guaranteed
remaining balance (“GRB”) if the account value is reduced to zero through a combination of market declines and withdrawals. The
GRB is generally equal to premiums less withdrawals. However, annual withdrawals that exceed a specific percentage of the premiums
paid may reduce the GRB by an amount greater than the withdrawals and may also impact the guaranteed annual withdrawal amount
that subsequently applies after the excess annual withdrawals occur. For certain of the withdrawal benefit features, the policyholder
also has the option, after a specified time period, to reset the GRB to the then-current account value, if greater. In addition, the
Company has introduced features, for contracts issued beginning in the fourth quarter of 2005, that allow policyholders to receive the
guaranteed annual withdrawal amount for as long as they are alive. Through this feature, the policyholder or their beneficiary will
receive the GRB and the GRB is reset on an annual basis to the maximum anniversary account value subject to a cap.
The GMWB represents an embedded derivative in the variable annuity contracts that is required to be reported separately from the host
variable annuity contract. It is carried at fair value and reported in other policyholder funds. The fair value of the GMWB obligation is
calculated based on actuarial and capital market assumptions related to the projected cash flows, including benefits and related contract
charges, over the lives of the contracts, incorporating expectations concerning policyholder behavior. Because of the dynamic and
complex nature of these cash flows, best estimate assumptions and stochastic techniques under a variety of market return scenarios are
used. Estimating these cash flows involves numerous estimates including those regarding expected market rates of return, market
volatility, correlations of market returns and discount rates. At each valuation date, the Company assumes expected returns based on
risk-free rates as represented by the current LIBOR forward curve rates; market volatility assumptions for each underlying index based
primarily on a blend of observed market “implied volatility”; correlations of market returns across underlying indices based on actual
observed market returns and relationships over the ten years preceding the valuation date; and current risk-free spot rates as represented
by the current LIBOR spot curve to determine the present value of expected future cash flows produced in the stochastic projection
process. As markets change, mature and evolve and actual policyholder behavior emerges, management continually evaluates the
appropriateness of its assumptions. In addition, management regularly evaluates the valuation model, incorporating emerging valuation