The Hartford 2007 Annual Report Download - page 181
Download and view the complete annual report
Please find page 181 of the 2007 The Hartford annual report below. You can navigate through the pages in the report by either clicking on the pages listed below, or by using the keyword search tool below to find specific information within the annual report.-
 1
1 -
2
-
3
-
4
-
5
-
6
-
7
-
8
-
9
-
10
-
11
-
12
-
13
-
14
-
15
-
16
-
17
-
18
-
19
-
20
-
21
-
22
-
23
-
24
-
25
-
26
-
27
-
28
-
29
-
30
-
31
-
32
-
33
-
34
-
35
-
36
-
37
-
38
-
39
-
40
-
41
-
42
-
43
-
44
-
45
-
46
-
47
-
48
-
49
-
50
-
51
-
52
-
53
-
54
-
55
-
56
-
57
-
58
-
59
-
60
-
61
-
62
-
63
-
64
-
65
-
66
-
67
-
68
-
69
-
70
-
71
-
72
-
73
-
74
-
75
-
76
-
77
-
78
-
79
-
80
-
81
-
82
-
83
-
84
-
85
-
86
-
87
-
88
-
89
-
90
-
91
-
92
-
93
-
94
-
95
-
96
-
97
-
98
-
99
-
100
-
101
-
102
-
103
-
104
-
105
-
106
-
107
-
108
-
109
-
110
-
111
-
112
-
113
-
114
-
115
-
116
-
117
-
118
-
119
-
120
-
121
-
122
-
123
-
124
-
125
-
126
-
127
-
128
-
129
-
130
-
131
-
132
-
133
-
134
-
135
-
136
-
137
-
138
-
139
-
140
-
141
-
142
-
143
-
144
-
145
-
146
-
147
-
148
-
149
-
150
-
151
-
152
-
153
-
154
-
155
-
156
-
157
-
158
-
159
-
160
-
161
-
162
-
163
-
164
-
165
-
166
-
167
-
168
-
169
-
170
-
 171
171 -
 172
172 -
 173
173 -
 174
174 -
 175
175 -
 176
176 -
 177
177 -
 178
178 -
 179
179 -
 180
180 -
 181
181 -
 182
182 -
 183
183 -
 184
184 -
 185
185 -
 186
186 -
 187
187 -
 188
188 -
 189
189 -
 190
190 -
 191
191 -
192
-
193
-
194
-
195
-
196
-
197
-
198
-
199
-
200
-
201
-
202
-
203
-
204
-
205
-
206
-
207
-
208
-
209
-
210
-
211
-
212
-
213
-
214
-
215
-
216
-
217
-
218
-
219
-
220
-
221
-
222
-
223
-
224
-
225
-
226
-
227
-
228
-
229
-
230
-
231
-
232
-
233
-
234
-
235
-
236
-
237
-
238
-
239
-
240
-
241
-
242
-
243
-
244
-
245
-
246
-
247
-
248
-
249
-
250
-
251
-
252
-
253
-
254
-
255
-
256
-
257
-
258
-
259
-
260
-
261
-
262
-
263
-
264
-
265
-
266
-
267
-
268
-
269
-
270
-
271
-
272
-
273
-
274
-
275
-
276
 |
 |

F-4
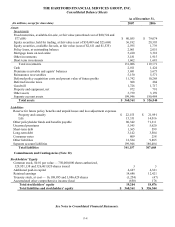
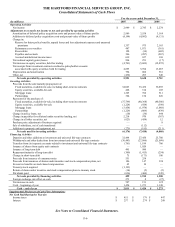
THE HARTFORD FINANCIAL SERVICES GROUP, INC.
Consolidated Balance Sheets
As of December 31,
(In millions, except for share data) 2007 2006
Assets
Investments
Fixed maturities, available-for-sale, at fair value (amortized cost of $80,724 and
$77,608) $
80,055
$
79,074
Equity securities, held for trading, at fair value (cost of $30,489 and $23,668) 36,182 29,393
Equity securities, available-for-sale, at fair value (cost of $2,611 and $1,535) 2,595 1,739
Policy loans, at outstanding balance 2,061 2,051
Mortgage loans on real estate 5,410 3,318
Other investments 3,181 1,915
Short-term investments 1,602 1,681
Total investments 131,086 119,171
Cash 2,011 1,424
Premiums receivable and agents’ balances 3,681 3,675
Reinsurance recoverables 5,150 5,571
Deferred policy acquisition costs and present value of future profits 11,742 10,268
Deferred income taxes 308 284
Goodwill 1,726 1,717
Property and equipment, net 972 791
Other assets 3,739 3,159
Separate account assets 199,946 180,484
Total assets $ 360,361 $ 326,544
Liabilities
Reserve for future policy benefits and unpaid losses and loss adjustment expenses
Property and casualty $ 22,153 $ 21,991
Life 15,331 14,016
Other policyholder funds and benefits payable 80,342 71,311
Unearned premiums 5,545 5,620
Short-term debt 1,365 599
Long-term debt 3,142 3,504
Consumer notes 809 258
Other liabilities 12,524 9,885
Separate account liabilities 199,946 180,484
Total liabilities 341,157 307,668
Commitments and Contingencies (Note 12)
Stockholders’ Equity
Common stock, $0.01 par value — 750,000,000 shares authorized,
329,951,138 and 326,401,820 shares issued
3
3
Additional paid-in capital 6,627 6,321
Retained earnings 14,686 12,421
Treasury stock, at cost — 16,108,895 and 3,086,429 shares (1,254) (47)
Accumulated other comprehensive income (loss) (858) 178
Total stockholders’ equity 19,204 18,876
Total liabilities and stockholders’ equity $ 360,361 $ 326,544
See Notes to Consolidated Financial Statements.