The Hartford 2007 Annual Report Download - page 253
Download and view the complete annual report
Please find page 253 of the 2007 The Hartford annual report below. You can navigate through the pages in the report by either clicking on the pages listed below, or by using the keyword search tool below to find specific information within the annual report.-
 1
1 -
2
-
3
-
4
-
5
-
6
-
7
-
8
-
9
-
10
-
11
-
12
-
13
-
14
-
15
-
16
-
17
-
18
-
19
-
20
-
21
-
22
-
23
-
24
-
25
-
26
-
27
-
28
-
29
-
30
-
31
-
32
-
33
-
34
-
35
-
36
-
37
-
38
-
39
-
40
-
41
-
42
-
43
-
44
-
45
-
46
-
47
-
48
-
49
-
50
-
51
-
52
-
53
-
54
-
55
-
56
-
57
-
58
-
59
-
60
-
61
-
62
-
63
-
64
-
65
-
66
-
67
-
68
-
69
-
70
-
71
-
72
-
73
-
74
-
75
-
76
-
77
-
78
-
79
-
80
-
81
-
82
-
83
-
84
-
85
-
86
-
87
-
88
-
89
-
90
-
91
-
92
-
93
-
94
-
95
-
96
-
97
-
98
-
99
-
100
-
101
-
102
-
103
-
104
-
105
-
106
-
107
-
108
-
109
-
110
-
111
-
112
-
113
-
114
-
115
-
116
-
117
-
118
-
119
-
120
-
121
-
122
-
123
-
124
-
125
-
126
-
127
-
128
-
129
-
130
-
131
-
132
-
133
-
134
-
135
-
136
-
137
-
138
-
139
-
140
-
141
-
142
-
143
-
144
-
145
-
146
-
147
-
148
-
149
-
150
-
151
-
152
-
153
-
154
-
155
-
156
-
157
-
158
-
159
-
160
-
161
-
162
-
163
-
164
-
165
-
166
-
167
-
168
-
169
-
170
-
171
-
172
-
173
-
174
-
175
-
176
-
177
-
178
-
179
-
180
-
181
-
182
-
183
-
184
-
185
-
186
-
187
-
188
-
189
-
190
-
191
-
192
-
193
-
194
-
195
-
196
-
197
-
198
-
199
-
200
-
201
-
202
-
203
-
204
-
205
-
206
-
207
-
208
-
209
-
210
-
211
-
212
-
213
-
214
-
215
-
216
-
217
-
218
-
219
-
220
-
221
-
222
-
223
-
224
-
225
-
226
-
227
-
228
-
229
-
230
-
231
-
232
-
233
-
234
-
235
-
236
-
237
-
238
-
239
-
240
-
241
-
242
-
 243
243 -
 244
244 -
 245
245 -
 246
246 -
 247
247 -
 248
248 -
 249
249 -
 250
250 -
 251
251 -
 252
252 -
 253
253 -
 254
254 -
 255
255 -
 256
256 -
 257
257 -
 258
258 -
 259
259 -
 260
260 -
 261
261 -
 262
262 -
 263
263 -
264
-
265
-
266
-
267
-
268
-
269
-
270
-
271
-
272
-
273
-
274
-
275
-
276
 |
 |

THE HARTFORD FINANCIAL SERVICES GROUP, INC.
NOTES TO CONSOLIDATED FINANCIAL STATEMENTS (continued)
F-76
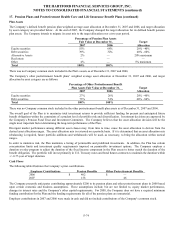
18. Stock Compensation Plans (continued)
an immaterial increase in net income for the year ended December 31, 2005 and an immaterial decrease in net income for the year
ended December 31, 2004. All awards provide for accelerated vesting upon a change in control of the Company as defined in the 2005
Stock Plan.
Stock Option Awards
Under the 2005 Stock Plan, all options granted have an exercise price equal to the market price of the Company’ s common stock on the
date of grant, and an option’ s maximum term is ten years. Certain options become exercisable over a three year period commencing
one year from the date of grant, while certain other options become exercisable at the later of three years from the date of grant or upon
specified market appreciation of the Company’ s common shares. For any year, no individual employee may receive an award of
options for more than 1,000,000 shares. As of December 31, 2007, The Hartford had not issued any incentive stock options under any
plans.
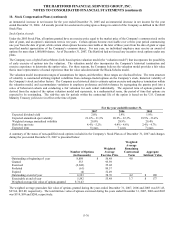
The Company uses a hybrid lattice/Monte-Carlo based option valuation model (the “valuation model”) that incorporates the possibility
of early exercise of options into the valuation. The valuation model also incorporates the Company’ s historical termination and
exercise experience to determine the option value. For these reasons, the Company believes the valuation model provides a fair value
that is more representative of actual experience than the value calculated under the Black-Scholes model.
The valuation model incorporates ranges of assumptions for inputs, and therefore, those ranges are disclosed below. The term structure
of volatility is constructed utilizing implied volatilities from exchange-traded options on the Company’ s stock, historical volatility of
the Company’s stock and other factors. The Company uses historical data to estimate option exercise and employee termination within
the valuation model, and accommodates variations in employee preference and risk-tolerance by segregating the grantee pool into a
series of behavioral cohorts and conducting a fair valuation for each cohort individually. The expected term of options granted is
derived from the output of the option valuation model and represents, in a mathematical sense, the period of time that options are
expected to be outstanding. The risk-free rate for periods within the contractual life of the option is based on the U.S. Constant
Maturity Treasury yield curve in effect at the time of grant.
For the year ended December 31,
2007 2006 2005
Expected dividend yield 2.0% 1.9% 1.9%
Expected annualized spot volatility 21.0 % - 31.3% 20.2% - 32.3% 19.5% - 33.4%
Weighted average annualized volatility 29.0% 28.9% 29.4%
Risk-free spot rate 4.4% - 5.2% 4.4% - 4.6% 2.4% - 4.7%
Expected term 8 years 7 years 7 years
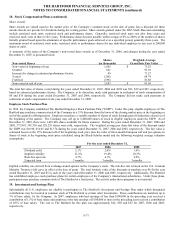
A summary of the status of non-qualified stock options included in the Company’ s Stock Plan as of December 31, 2007 and changes
during the year ended December 31, 2007 is presented below:
Number of Options
(in thousands)
Weighted
Average
Exercise Price
Weighted
Average
Remaining
Contractual
Term
Aggregate
Intrinsic Value
Outstanding at beginning of year 8,898 $ 56.48 4.8
Granted 333 93.59
Exercised (2,843) 55.02
Forfeited (61) 89.57
Expired (4) 52.49
Outstanding at end of year 6,323 58.76 4.2 $ 180
Exercisable at end of year 5,592 55.48 3.7 $ 177
Weighted average fair value of options granted $ 31.43
The weighted average grant-date fair value of options granted during the years ended December 31, 2007, 2006 and 2005 was $31.43,
$27.66, $22.89, respectively. The total intrinsic value of options exercised during the years ended December 31, 2007, 2006 and 2005
was $114, $99 and $200, respectively.