The Hartford 2007 Annual Report Download - page 267
Download and view the complete annual report
Please find page 267 of the 2007 The Hartford annual report below. You can navigate through the pages in the report by either clicking on the pages listed below, or by using the keyword search tool below to find specific information within the annual report.-
 1
1 -
2
-
3
-
4
-
5
-
6
-
7
-
8
-
9
-
10
-
11
-
12
-
13
-
14
-
15
-
16
-
17
-
18
-
19
-
20
-
21
-
22
-
23
-
24
-
25
-
26
-
27
-
28
-
29
-
30
-
31
-
32
-
33
-
34
-
35
-
36
-
37
-
38
-
39
-
40
-
41
-
42
-
43
-
44
-
45
-
46
-
47
-
48
-
49
-
50
-
51
-
52
-
53
-
54
-
55
-
56
-
57
-
58
-
59
-
60
-
61
-
62
-
63
-
64
-
65
-
66
-
67
-
68
-
69
-
70
-
71
-
72
-
73
-
74
-
75
-
76
-
77
-
78
-
79
-
80
-
81
-
82
-
83
-
84
-
85
-
86
-
87
-
88
-
89
-
90
-
91
-
92
-
93
-
94
-
95
-
96
-
97
-
98
-
99
-
100
-
101
-
102
-
103
-
104
-
105
-
106
-
107
-
108
-
109
-
110
-
111
-
112
-
113
-
114
-
115
-
116
-
117
-
118
-
119
-
120
-
121
-
122
-
123
-
124
-
125
-
126
-
127
-
128
-
129
-
130
-
131
-
132
-
133
-
134
-
135
-
136
-
137
-
138
-
139
-
140
-
141
-
142
-
143
-
144
-
145
-
146
-
147
-
148
-
149
-
150
-
151
-
152
-
153
-
154
-
155
-
156
-
157
-
158
-
159
-
160
-
161
-
162
-
163
-
164
-
165
-
166
-
167
-
168
-
169
-
170
-
171
-
172
-
173
-
174
-
175
-
176
-
177
-
178
-
179
-
180
-
181
-
182
-
183
-
184
-
185
-
186
-
187
-
188
-
189
-
190
-
191
-
192
-
193
-
194
-
195
-
196
-
197
-
198
-
199
-
200
-
201
-
202
-
203
-
204
-
205
-
206
-
207
-
208
-
209
-
210
-
211
-
212
-
213
-
214
-
215
-
216
-
217
-
218
-
219
-
220
-
221
-
222
-
223
-
224
-
225
-
226
-
227
-
228
-
229
-
230
-
231
-
232
-
233
-
234
-
235
-
236
-
237
-
238
-
239
-
240
-
241
-
242
-
243
-
244
-
245
-
246
-
247
-
248
-
249
-
250
-
251
-
252
-
253
-
254
-
255
-
256
-
 257
257 -
 258
258 -
 259
259 -
 260
260 -
 261
261 -
 262
262 -
 263
263 -
 264
264 -
 265
265 -
 266
266 -
 267
267 -
 268
268 -
 269
269 -
 270
270 -
 271
271 -
 272
272 -
 273
273 -
 274
274 -
 275
275 -
 276
276
 |
 |

II-5
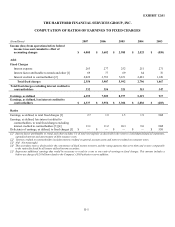
EXHIBIT 12.01
THE HARTFORD FINANCIAL SERVICES GROUP, INC.
COMPUTATION OF RATIOS OF EARNINGS TO FIXED CHARGES
(In millions) 2007 2006 2005 2004 2003
Income (loss) from operations before federal
income taxes and cumulative effect of
accounting changes
$
4,005
$
3,602
$
2,985
$
2,523
$
(550)
Add:
Fixed Charges
Interest expense 263 277 252 251 271
Interest factor attributable to rentals and other [1] 69 77 69 64 76
Interest credited to contractholders [2] 2,022 3,553 5,671 2,481 1,120
Total fixed charges 2,354 3,907 5,992 2,796 1,467
Total fixed charges excluding interest credited to
contractholders
332
354
321
315
347
Earnings, as defined
6,359
7,509
8,977
5,319
917
Earnings, as defined, less interest credited to
contractholders
$
4,337
$
3,956
$
3,306
$
2,838
$
(203)
Ratios
Earnings, as defined, to total fixed charges [3] 2.7 1.9 1.5 1.9 NM
Earnings, as defined, less interest credited to
contractholders, to total fixed charges excluding
interest credited to contractholders [3] [4]
13.1
11.2
10.3
9.0
NM
Deficiency of earnings, as defined, to fixed charges [5] $ — $ — $ — $ — $ 550
[1] Interest factor attributable to rental and other includes 1/3 of total rent expense as disclosed in the notes to consolidated financial statements,
capitalized interest and amortization of debt issuance costs.
[2] Interest credited to contractholders includes interest credited on general account assets and interest credited on consumer notes.
[3] NM: Not meaningful.
[4] This secondary ratio is disclosed for the convenience of fixed income investors and the rating agencies that serve them and is more comparable
to the ratios disclosed by all issuers of fixed income securities.
[5] Represents additional earnings that would be necessary to result in a one to one ratio of earnings to fixed charges. This amount includes a
before-tax charge of $2.6 billion related to the Company’s 2003 asbestos reserve addition.