The Hartford 2007 Annual Report Download - page 232
Download and view the complete annual report
Please find page 232 of the 2007 The Hartford annual report below. You can navigate through the pages in the report by either clicking on the pages listed below, or by using the keyword search tool below to find specific information within the annual report.-
 1
1 -
2
-
3
-
4
-
5
-
6
-
7
-
8
-
9
-
10
-
11
-
12
-
13
-
14
-
15
-
16
-
17
-
18
-
19
-
20
-
21
-
22
-
23
-
24
-
25
-
26
-
27
-
28
-
29
-
30
-
31
-
32
-
33
-
34
-
35
-
36
-
37
-
38
-
39
-
40
-
41
-
42
-
43
-
44
-
45
-
46
-
47
-
48
-
49
-
50
-
51
-
52
-
53
-
54
-
55
-
56
-
57
-
58
-
59
-
60
-
61
-
62
-
63
-
64
-
65
-
66
-
67
-
68
-
69
-
70
-
71
-
72
-
73
-
74
-
75
-
76
-
77
-
78
-
79
-
80
-
81
-
82
-
83
-
84
-
85
-
86
-
87
-
88
-
89
-
90
-
91
-
92
-
93
-
94
-
95
-
96
-
97
-
98
-
99
-
100
-
101
-
102
-
103
-
104
-
105
-
106
-
107
-
108
-
109
-
110
-
111
-
112
-
113
-
114
-
115
-
116
-
117
-
118
-
119
-
120
-
121
-
122
-
123
-
124
-
125
-
126
-
127
-
128
-
129
-
130
-
131
-
132
-
133
-
134
-
135
-
136
-
137
-
138
-
139
-
140
-
141
-
142
-
143
-
144
-
145
-
146
-
147
-
148
-
149
-
150
-
151
-
152
-
153
-
154
-
155
-
156
-
157
-
158
-
159
-
160
-
161
-
162
-
163
-
164
-
165
-
166
-
167
-
168
-
169
-
170
-
171
-
172
-
173
-
174
-
175
-
176
-
177
-
178
-
179
-
180
-
181
-
182
-
183
-
184
-
185
-
186
-
187
-
188
-
189
-
190
-
191
-
192
-
193
-
194
-
195
-
196
-
197
-
198
-
199
-
200
-
201
-
202
-
203
-
204
-
205
-
206
-
207
-
208
-
209
-
210
-
211
-
212
-
213
-
214
-
215
-
216
-
217
-
218
-
219
-
220
-
221
-
 222
222 -
 223
223 -
 224
224 -
 225
225 -
 226
226 -
 227
227 -
 228
228 -
 229
229 -
 230
230 -
 231
231 -
 232
232 -
 233
233 -
 234
234 -
 235
235 -
 236
236 -
 237
237 -
 238
238 -
 239
239 -
 240
240 -
 241
241 -
 242
242 -
243
-
244
-
245
-
246
-
247
-
248
-
249
-
250
-
251
-
252
-
253
-
254
-
255
-
256
-
257
-
258
-
259
-
260
-
261
-
262
-
263
-
264
-
265
-
266
-
267
-
268
-
269
-
270
-
271
-
272
-
273
-
274
-
275
-
276
 |
 |

THE HARTFORD FINANCIAL SERVICES GROUP, INC.
NOTES TO CONSOLIDATED FINANCIAL STATEMENTS (continued)
F-55
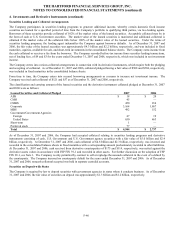
9. Separate Accounts, Death Benefits and Other Insurance Benefit Features (continued)
techniques where appropriate, including drawing on the expertise of market participants and valuation experts. During the second
quarter of 2007, the Company reflected newly reliable market inputs for volatility on Standard and Poor’ s (“S&P”) 500, National
Association of Securities Dealers Automated Quotations (“NASDAQ”) and Europe, Australasia and Far East (“EAFE”) index options.
As of December 31, 2007 and December 31, 2006, the embedded derivative (liability) asset recorded for GMWB, before reinsurance or
hedging, was $(715) and $53, respectively. During 2007, 2006, and 2005, the change in value of the GMWB, before reinsurance and
hedging, reported in realized gains (losses) was $(670), $121, and $(64), respectively. Included in the realized gain (loss) for the year
ended December 31, 2007 and 2006, were liability model refinements, changes in policyholder behavior assumptions, and changes in
other assumptions to reflect newly reliable market inputs for volatility of a net $(234) and $(2), respectively.
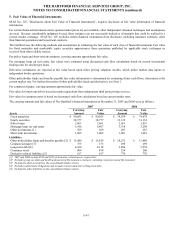
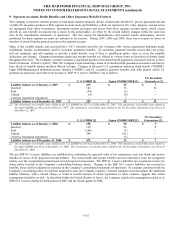
As of December 31, 2007 and December 31, 2006, $47.4 billion, or 83%, and $37.3 billion, or 77%, respectively, of account value,
representing substantially all of the contracts written after July 2003 with the GMWB feature were unreinsured. In order to minimize
the volatility associated with the unreinsured GMWB liabilities, the Company has established a risk management strategy. During the
second and third quarter of 2007, as part of the Company’ s risk management strategy, the Company purchased two customized swap
contracts to hedge certain capital market risk components for the remaining term of certain blocks of non-reinsured GMWB riders. As
of December 31, 2007, these swaps had a notional value of $12.8 billion. These customized derivative contracts provide protection
from capital markets risks based on policyholder behavior assumptions as specified by the Company. The Company also uses other
derivative instruments to hedge its unreinsured GMWB exposure including interest rate futures, S&P 500 and NASDAQ index options
and futures contracts and EAFE Index swaps to hedge GMWB exposure to international equity markets. The total (reinsured and
unreinsured) GRB as of December 31, 2007 and 2006 was $45.9 billion and $37.8 billion, respectively.
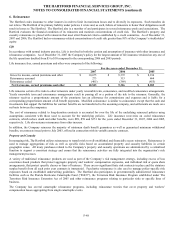
A contract is ‘in the money’ if the contract holder’ s GRB is greater than the account value. For contracts that were ‘in the money’ the
Company’ s exposure, as of December 31, 2007 and December 31, 2006, after reinsurance, was $146 and $8, respectively. However,
the only ways the contract holder can monetize the excess of the GRB over the account value of the contract is upon death or if their
account value is reduced to zero through a combination of a series of withdrawals that do not exceed a specific percentage of the
premiums paid per year and market declines. If the account value is reduced to zero, the contract holder will receive a period certain
annuity equal to the remaining GRB. As the amount of the excess of the GRB over the account value can fluctuate with equity market
returns on a daily basis, the ultimate amount to be paid by the Company, if any, is uncertain and could be significantly more or less
than $146.
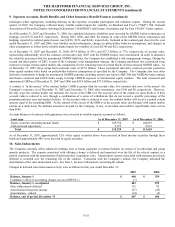
Account balances of contracts with guarantees were invested in variable separate accounts as follows:
Asset type As of December 31, 2007 As of December 31, 2006
Equity securities (including mutual funds) $ 109,354 $ 104,687
Cash and cash equivalents 9,975 8,931
Total $ 119,329 $ 113,618
As of December 31, 2007, approximately 12% of the equity securities above were invested in fixed income securities through these
funds and approximately 88% were invested in equity securities.
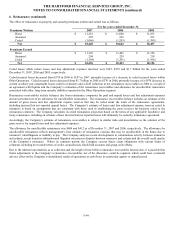
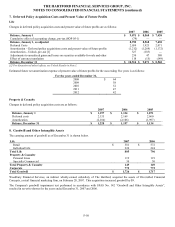
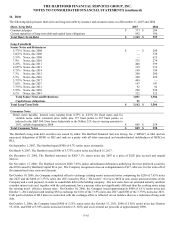
10. Sales Inducements
The Company currently offers enhanced crediting rates or bonus payments to contract holders on certain of its individual and group
annuity products. The expense associated with offering a bonus is deferred and amortized over the life of the related contract in a
pattern consistent with the amortization of deferred policy acquisition costs. Amortization expense associated with expenses previously
deferred is recorded over the remaining life of the contract. Consistent with the Company’ s unlock, the Company unlocked the
amortization of the sales inducement asset. See Note 1, for more information concerning the unlock.
Changes in deferred sales inducement activity were as follows for the year ended December 31:
2007 2006
Balance, January 1 $ 404 $ 359
Cumulative effect of accounting change, pre-tax (SOP 05-1) (1) —
Balance, January 1, as adjusted 403 359
Sales inducements deferred 115 92
Amortization charged to income (37) (43)
Amortization – unlock (14) (4)
Balance, end of period, December 31 $ 467 $ 404