The Hartford 2007 Annual Report Download - page 79
Download and view the complete annual report
Please find page 79 of the 2007 The Hartford annual report below. You can navigate through the pages in the report by either clicking on the pages listed below, or by using the keyword search tool below to find specific information within the annual report.-
 1
1 -
2
-
3
-
4
-
5
-
6
-
7
-
8
-
9
-
10
-
11
-
12
-
13
-
14
-
15
-
16
-
17
-
18
-
19
-
20
-
21
-
22
-
23
-
24
-
25
-
26
-
27
-
28
-
29
-
30
-
31
-
32
-
33
-
34
-
35
-
36
-
37
-
38
-
39
-
40
-
41
-
42
-
43
-
44
-
45
-
46
-
47
-
48
-
49
-
50
-
51
-
52
-
53
-
54
-
55
-
56
-
57
-
58
-
59
-
60
-
61
-
62
-
63
-
64
-
65
-
66
-
67
-
68
-
 69
69 -
 70
70 -
 71
71 -
 72
72 -
 73
73 -
 74
74 -
 75
75 -
 76
76 -
 77
77 -
 78
78 -
 79
79 -
 80
80 -
 81
81 -
 82
82 -
 83
83 -
 84
84 -
 85
85 -
 86
86 -
 87
87 -
 88
88 -
 89
89 -
90
-
91
-
92
-
93
-
94
-
95
-
96
-
97
-
98
-
99
-
100
-
101
-
102
-
103
-
104
-
105
-
106
-
107
-
108
-
109
-
110
-
111
-
112
-
113
-
114
-
115
-
116
-
117
-
118
-
119
-
120
-
121
-
122
-
123
-
124
-
125
-
126
-
127
-
128
-
129
-
130
-
131
-
132
-
133
-
134
-
135
-
136
-
137
-
138
-
139
-
140
-
141
-
142
-
143
-
144
-
145
-
146
-
147
-
148
-
149
-
150
-
151
-
152
-
153
-
154
-
155
-
156
-
157
-
158
-
159
-
160
-
161
-
162
-
163
-
164
-
165
-
166
-
167
-
168
-
169
-
170
-
171
-
172
-
173
-
174
-
175
-
176
-
177
-
178
-
179
-
180
-
181
-
182
-
183
-
184
-
185
-
186
-
187
-
188
-
189
-
190
-
191
-
192
-
193
-
194
-
195
-
196
-
197
-
198
-
199
-
200
-
201
-
202
-
203
-
204
-
205
-
206
-
207
-
208
-
209
-
210
-
211
-
212
-
213
-
214
-
215
-
216
-
217
-
218
-
219
-
220
-
221
-
222
-
223
-
224
-
225
-
226
-
227
-
228
-
229
-
230
-
231
-
232
-
233
-
234
-
235
-
236
-
237
-
238
-
239
-
240
-
241
-
242
-
243
-
244
-
245
-
246
-
247
-
248
-
249
-
250
-
251
-
252
-
253
-
254
-
255
-
256
-
257
-
258
-
259
-
260
-
261
-
262
-
263
-
264
-
265
-
266
-
267
-
268
-
269
-
270
-
271
-
272
-
273
-
274
-
275
-
276
 |
 |

79
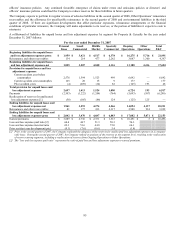
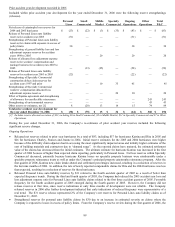
• Primarily driving the $121 increase in net investment income was a larger investment base due to increased cash flows from
underwriting as well as an increase in interest rates and a change in asset mix (i.e., a greater share of investments in mortgage loans
and limited partnerships).
• The change to $64 of net favorable prior accident year development in 2006 for Ongoing Operations was primarily due to an $83
release of prior accident year hurricane reserves and a $58 release of allocated loss adjustment expense reserves for workers’
compensation and package business, partially offset by reserve strengthenings in Specialty Commercial. See the “Reserves”
section for a discussion of prior accident year reserve development.
• Net realized capital gains decreased by $35 in total, primarily due to a $24, pre-tax, realized capital loss from the sale of Omni, an
increase in other-than-temporary-impairments and losses on the sale of fixed maturity investments, partially offset by an increase in
income from other sources.
• Excluding the change in Citizens assessments and catastrophe treaty reinstatement premium, Ongoing Operations’ current accident
year underwriting results before catastrophes were down $10 from 2005 to 2006. The current accident year loss and loss
adjustment expense ratio before catastrophes of 62.4 for Ongoing Operations was relatively flat from 2005 to 2006 as a lower
current accident year loss and loss adjustment expense ratio for workers’ compensation business in Small Commercial was largely
offset by an increase in non-catastrophe property loss costs in Middle Market and Personal Lines homeowners.
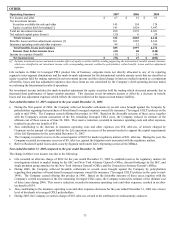
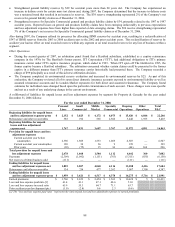
Key Performance Ratios and Measures
The Company considers several measures and ratios to be the key performance indicators for the property and casualty underwriting
businesses. The following table and the segment discussions for the years ended December 31, 2007, 2006 and 2005 include various
ratios and measures of profitability. Management believes that these ratios and measures are useful in understanding the underlying
trends in The Hartford’ s property and casualty insurance underwriting business. However, these key performance indicators should
only be used in conjunction with, and not in lieu of, underwriting income for the underwriting segments of Personal Lines, Small
Commercial, Middle Market and Specialty Commercial and net income for the Property & Casualty business as a whole, Ongoing
Operations and Other Operations. These ratios and measures may not be comparable to other performance measures used by the
Company’ s competitors.
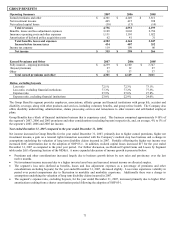
Ongoing Operations earned premium growth 2007 2006 2005
Personal Lines 3% 4% 5%
Small Commercial 3% 10% 17%
Middle Market (4%) 4% 6%
Specialty Commercial (3%) (12%) 2%
Ongoing Operations 1% 3% 7%
Ongoing Operations combined ratio
Combined ratio before catastrophes and prior year development 90.5 88.0 89.4
Catastrophe ratio
Current year 1.7 1.9 3.5
Prior years 0.1 (0.7) 0.1
Total catastrophe ratio 1.8 1.2 3.6
Non-catastrophe prior year development (1.5) 0.1 0.2
Combined ratio 90.8 89.3 93.2
Other Operations net income (loss) $ 30 $ (35) $ 71
Total Property & Casualty measures of net investment income
Investment yield, after-tax 4.4% 4.1% 4.1%
Average annual invested assets at cost $ 29,760 $ 27,324 $ 25,148
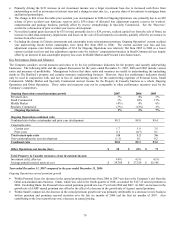
Year ended December 31, 2007 compared to the year ended December 31, 2006
Ongoing Operations earned premium growth
• Within Personal Lines, the decrease in the earned premium growth rate from 2006 to 2007 was due to the Company’ s exit from the
Omni non-standard auto business. Omni, which was sold in the fourth quarter of 2006, accounted for $127 of earned premium in
2006. Excluding Omni, the Personal Lines earned premium growth rate was 7% in both 2006 and 2007. In 2007, an increase in the
growth rate of AARP earned premium was offset by the effect of a decrease in the growth rate of Agency earned premium.
• Within Small Commercial, the decrease in the earned premium growth rate was primarily attributable to a decrease in new business
written premium and premium renewal retention over the last six months of 2006 and the first six months of 2007. Also
contributing to the lower growth rate was a decrease in earned pricing.