The Hartford 2007 Annual Report Download - page 59
Download and view the complete annual report
Please find page 59 of the 2007 The Hartford annual report below. You can navigate through the pages in the report by either clicking on the pages listed below, or by using the keyword search tool below to find specific information within the annual report.-
 1
1 -
2
-
3
-
4
-
5
-
6
-
7
-
8
-
9
-
10
-
11
-
12
-
13
-
14
-
15
-
16
-
17
-
18
-
19
-
20
-
21
-
22
-
23
-
24
-
25
-
26
-
27
-
28
-
29
-
30
-
31
-
32
-
33
-
34
-
35
-
36
-
37
-
38
-
39
-
40
-
41
-
42
-
43
-
44
-
45
-
46
-
47
-
48
-
 49
49 -
 50
50 -
 51
51 -
 52
52 -
 53
53 -
 54
54 -
 55
55 -
 56
56 -
 57
57 -
 58
58 -
 59
59 -
 60
60 -
 61
61 -
 62
62 -
 63
63 -
 64
64 -
 65
65 -
 66
66 -
 67
67 -
 68
68 -
 69
69 -
70
-
71
-
72
-
73
-
74
-
75
-
76
-
77
-
78
-
79
-
80
-
81
-
82
-
83
-
84
-
85
-
86
-
87
-
88
-
89
-
90
-
91
-
92
-
93
-
94
-
95
-
96
-
97
-
98
-
99
-
100
-
101
-
102
-
103
-
104
-
105
-
106
-
107
-
108
-
109
-
110
-
111
-
112
-
113
-
114
-
115
-
116
-
117
-
118
-
119
-
120
-
121
-
122
-
123
-
124
-
125
-
126
-
127
-
128
-
129
-
130
-
131
-
132
-
133
-
134
-
135
-
136
-
137
-
138
-
139
-
140
-
141
-
142
-
143
-
144
-
145
-
146
-
147
-
148
-
149
-
150
-
151
-
152
-
153
-
154
-
155
-
156
-
157
-
158
-
159
-
160
-
161
-
162
-
163
-
164
-
165
-
166
-
167
-
168
-
169
-
170
-
171
-
172
-
173
-
174
-
175
-
176
-
177
-
178
-
179
-
180
-
181
-
182
-
183
-
184
-
185
-
186
-
187
-
188
-
189
-
190
-
191
-
192
-
193
-
194
-
195
-
196
-
197
-
198
-
199
-
200
-
201
-
202
-
203
-
204
-
205
-
206
-
207
-
208
-
209
-
210
-
211
-
212
-
213
-
214
-
215
-
216
-
217
-
218
-
219
-
220
-
221
-
222
-
223
-
224
-
225
-
226
-
227
-
228
-
229
-
230
-
231
-
232
-
233
-
234
-
235
-
236
-
237
-
238
-
239
-
240
-
241
-
242
-
243
-
244
-
245
-
246
-
247
-
248
-
249
-
250
-
251
-
252
-
253
-
254
-
255
-
256
-
257
-
258
-
259
-
260
-
261
-
262
-
263
-
264
-
265
-
266
-
267
-
268
-
269
-
270
-
271
-
272
-
273
-
274
-
275
-
276
 |
 |

59
• Individual Life’ s decrease in after-tax margin, excluding realized gains (losses) and DAC unlock, is primarily due to unfavorable
mortality experience in 2007 compared to 2006.
• The increase in the Group Benefits after-tax margin, excluding buyouts, excluding realized gains (losses), was due to an
improvement in the loss ratio, partially offset by higher DAC amortization.
Year ended December 31, 2006 compared to year ended December 31, 2005
• The decrease in Retail individual annuity’ s ROA, excluding realized gain (losses) and DAC unlock, was primarily due to an
increase in trail commissions in 2006.
• The decrease in Retirement Plan’ s ROA, excluding realized gains (losses) and DAC unlock, was primarily due to higher
maintenance expenses in 2006.
• The decrease in Institutional’ s ROA, excluding realized gains (losses) and DAC unlock, is primarily due to higher maintenance
expense in 2006.
• Individual Life’ s after-tax margin, excluding realized gains (losses) and DAC unlock, increased primarily due to favorable
mortality experience in 2006 compared to 2005 as well as favorable revisions to DAC estimates reflected in the first half of 2006.
• The improvement in the Group Benefits after-tax margin, excluding realized gains (losses) and DAC unlock, for 2006 was
primarily due to an improvement in the loss ratio, including the release of certain life reserves, partially offset by higher income tax
expense.
• International’ s ROA, excluding realized gains (losses) and DAC unlock, increased significantly in 2006 primarily due to the
leveraging of its existing infrastructure through disciplined expense management.
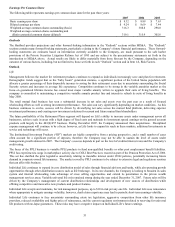
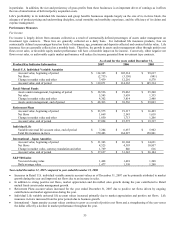
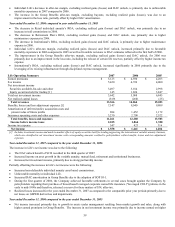
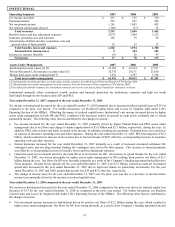
Life Operating Summary 2007 2006 2005
Earned premiums $5,123 $ 4,590 $ 4,203
Fee income 5,420 4,726 4,000
Net investment income
Securities available-for-sale and other 3,497 3,184 2,998
Equity securities held for trading [1] 145 1,824 3,847
Total net investment income 3,642 5,008 6,845
Net realized capital losses (819) (260) (25)
Total revenues 13,366 14,064 15,023
Benefits, losses and loss adjustment expenses [1] 7,147 8,040 9,809
Amortization of deferred policy acquisition costs and
present value of future profits
884
1,452 1,172
Insurance operating costs and other expenses 3,230 2,708 2,522
Total benefits, losses and expenses 11,261 12,200 13,503
Income before income taxes 2,105 1,864 1,520
Income tax expense 547 423 316
Net income $1,558 $ 1,441 $ 1,204
[1] Includes investment income and mark-to-market effects of equity securities held for trading supporting the international variable annuity business,
which are classified in net investment income with corresponding amounts credited to policyholders within benefits, losses and loss adjustment
expenses.
Year ended December 31, 2007 compared to the year ended December 31, 2006
The increase in Life’ s net income was due to the following:
• The DAC unlock benefit of $210 recorded in the third quarter of 2007.
• Increased income on asset growth in the variable annuity, mutual fund, retirement and institutional businesses.
• Increased net investment income, primarily due to strong partnership income.
Partially offsetting the increase in Life’ s net income were the following:
• Increased non-deferrable individual annuity asset based commissions.
• Unfavorable mortality in Individual Life.
• Increased DAC amortization in Group Benefits due to the adoption of SOP 05-1.
• During the first quarter of 2006, the Company achieved favorable settlements in several cases brought against the Company by
policyholders regarding their purchase of broad-based leveraged corporate owned life insurance ("leveraged COLI") policies in the
early to mid-1990s and therefore, released a reserve for these matters of $34, after-tax.
• Realized losses increased for the year ended December 31, 2007 as compared to the comparable prior year periods primarily due to
net losses on GMWB derivatives and impairments.
Year ended December 31, 2006 compared to the year ended December 31, 2005
• Net income increased primarily due to growth in assets under management resulting from market growth and sales, along with
higher earned premiums in Group Benefits. The increase in net investment income was primarily due to income earned on higher