The Hartford 2007 Annual Report Download - page 85
Download and view the complete annual report
Please find page 85 of the 2007 The Hartford annual report below. You can navigate through the pages in the report by either clicking on the pages listed below, or by using the keyword search tool below to find specific information within the annual report.-
 1
1 -
2
-
3
-
4
-
5
-
6
-
7
-
8
-
9
-
10
-
11
-
12
-
13
-
14
-
15
-
16
-
17
-
18
-
19
-
20
-
21
-
22
-
23
-
24
-
25
-
26
-
27
-
28
-
29
-
30
-
31
-
32
-
33
-
34
-
35
-
36
-
37
-
38
-
39
-
40
-
41
-
42
-
43
-
44
-
45
-
46
-
47
-
48
-
49
-
50
-
51
-
52
-
53
-
54
-
55
-
56
-
57
-
58
-
59
-
60
-
61
-
62
-
63
-
64
-
65
-
66
-
67
-
68
-
69
-
70
-
71
-
72
-
73
-
74
-
 75
75 -
 76
76 -
 77
77 -
 78
78 -
 79
79 -
 80
80 -
 81
81 -
 82
82 -
 83
83 -
 84
84 -
 85
85 -
 86
86 -
 87
87 -
 88
88 -
 89
89 -
 90
90 -
 91
91 -
 92
92 -
 93
93 -
 94
94 -
 95
95 -
96
-
97
-
98
-
99
-
100
-
101
-
102
-
103
-
104
-
105
-
106
-
107
-
108
-
109
-
110
-
111
-
112
-
113
-
114
-
115
-
116
-
117
-
118
-
119
-
120
-
121
-
122
-
123
-
124
-
125
-
126
-
127
-
128
-
129
-
130
-
131
-
132
-
133
-
134
-
135
-
136
-
137
-
138
-
139
-
140
-
141
-
142
-
143
-
144
-
145
-
146
-
147
-
148
-
149
-
150
-
151
-
152
-
153
-
154
-
155
-
156
-
157
-
158
-
159
-
160
-
161
-
162
-
163
-
164
-
165
-
166
-
167
-
168
-
169
-
170
-
171
-
172
-
173
-
174
-
175
-
176
-
177
-
178
-
179
-
180
-
181
-
182
-
183
-
184
-
185
-
186
-
187
-
188
-
189
-
190
-
191
-
192
-
193
-
194
-
195
-
196
-
197
-
198
-
199
-
200
-
201
-
202
-
203
-
204
-
205
-
206
-
207
-
208
-
209
-
210
-
211
-
212
-
213
-
214
-
215
-
216
-
217
-
218
-
219
-
220
-
221
-
222
-
223
-
224
-
225
-
226
-
227
-
228
-
229
-
230
-
231
-
232
-
233
-
234
-
235
-
236
-
237
-
238
-
239
-
240
-
241
-
242
-
243
-
244
-
245
-
246
-
247
-
248
-
249
-
250
-
251
-
252
-
253
-
254
-
255
-
256
-
257
-
258
-
259
-
260
-
261
-
262
-
263
-
264
-
265
-
266
-
267
-
268
-
269
-
270
-
271
-
272
-
273
-
274
-
275
-
276
 |
 |

85
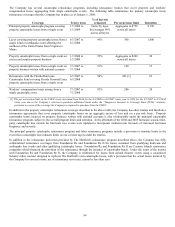
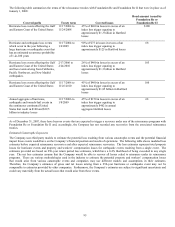
officers’ insurance policies. Any continued favorable emergence of claims under errors and omissions policies or directors’ and
officers’ insurance policies could lead the Company to reduce reserves for these liabilities in future quarters.
The Company expects to perform its regular reviews of asbestos liabilities in the second quarter of 2008, Other Operations’ reinsurance
recoverables and the allowance for uncollectible reinsurance in the second quarter of 2008 and environmental liabilities in the third
quarter of 2008. If there are significant developments that affect particular exposures, reinsurance arrangements or the financial
conditions of particular reinsurers, the Company will make adjustments to its reserves, or the portion of liabilities it expects to cede to
reinsurers.
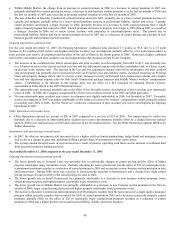
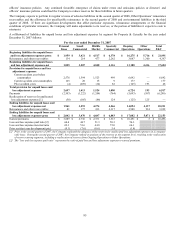
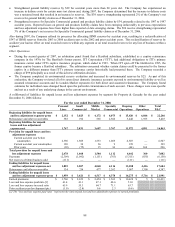
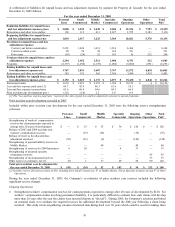
A rollforward of liabilities for unpaid losses and loss adjustment expenses by segment for Property & Casualty for the year ended
December 31, 2007 follows:
For the year ended December 31, 2007
Personal
Lines
Small
Commercial
Middle
Market
Specialty
Commercial
Ongoing
Operations
Other
Operations
Total
P&C
Beginning liabilities for unpaid losses
and loss adjustment expenses-gross
$
1,959
$
3,421
$
4,517
$
6,378 $
16,275
$
5,716
$ 21,991
Reinsurance and other recoverables 134 214 477 2,262 3,087 1,300 4,387
Beginning liabilities for unpaid losses
and loss adjustment expenses-net
1,825
3,207
4,040
4,116
13,188
4,416
17,604
Provision for unpaid losses and loss
adjustment expenses
Current accident year before
catastrophes
2,576
1,594
1,523
999
6,692
—
6,692
Current accident year catastrophes 125 28 15 9 177 — 177
Prior accident years (4) (209) (14) 82 (145) 193 48
Total provision for unpaid losses and
loss adjustment expenses
2,697
1,413
1,524
1,090
6,724
193
6,917
Payments (2,503) (1,222) (1,204) (764) (5,693) (597) (6,290)
Reallocation of reserves for unallocated
loss adjustment expenses [1]
(58)
(105)
(86)
124
(125)
125
—
Ending liabilities for unpaid losses and
loss adjustment expenses-net
1,961
3,293
4,274
4,566
14,094
4,137
18,231
Reinsurance and other recoverables 81 177 413 2,317 2,988 934 3,922
Ending liabilities for unpaid losses and
loss adjustment expenses-gross
$
2,042
$
3,470
$
4,687
$
6,883 $
17,082
$
5,071
$ 22,153
Earned premiums $ 3,889 $ 2,736 $2,351 $1,515 $ 10,491 $ 5 $ 10,496
Loss and loss expense paid ratio [2] 64.4 44.7 51.3 50.3 54.3
Loss and loss expense incurred ratio 69.3 51.6 64.8 72.0 64.1
Prior accident year development (pts.) (0.1) (7.6) (0.6) 5.4 (1.4)
[1] Prior to the second quarter of 2007, the Company evaluated the adequacy of the reserves for unallocated loss adjustment expenses on a company-
wide basis. During the second quarter of 2007, the Company refined its analysis of the reserves at the segment level, resulting in the reallocation
of reserves among segments, including a reallocation of reserves from Ongoing Operations to Other Operations.
[2] The “loss and loss expense paid ratio” represents the ratio of paid loss and loss adjustment expenses to earned premiums.