The Hartford 2007 Annual Report Download - page 40
Download and view the complete annual report
Please find page 40 of the 2007 The Hartford annual report below. You can navigate through the pages in the report by either clicking on the pages listed below, or by using the keyword search tool below to find specific information within the annual report.-
 1
1 -
2
-
3
-
4
-
5
-
6
-
7
-
8
-
9
-
10
-
11
-
12
-
13
-
14
-
15
-
16
-
17
-
18
-
19
-
20
-
21
-
22
-
23
-
24
-
25
-
26
-
27
-
28
-
29
-
 30
30 -
 31
31 -
 32
32 -
 33
33 -
 34
34 -
 35
35 -
 36
36 -
 37
37 -
 38
38 -
 39
39 -
 40
40 -
 41
41 -
 42
42 -
 43
43 -
 44
44 -
 45
45 -
 46
46 -
 47
47 -
 48
48 -
 49
49 -
 50
50 -
51
-
52
-
53
-
54
-
55
-
56
-
57
-
58
-
59
-
60
-
61
-
62
-
63
-
64
-
65
-
66
-
67
-
68
-
69
-
70
-
71
-
72
-
73
-
74
-
75
-
76
-
77
-
78
-
79
-
80
-
81
-
82
-
83
-
84
-
85
-
86
-
87
-
88
-
89
-
90
-
91
-
92
-
93
-
94
-
95
-
96
-
97
-
98
-
99
-
100
-
101
-
102
-
103
-
104
-
105
-
106
-
107
-
108
-
109
-
110
-
111
-
112
-
113
-
114
-
115
-
116
-
117
-
118
-
119
-
120
-
121
-
122
-
123
-
124
-
125
-
126
-
127
-
128
-
129
-
130
-
131
-
132
-
133
-
134
-
135
-
136
-
137
-
138
-
139
-
140
-
141
-
142
-
143
-
144
-
145
-
146
-
147
-
148
-
149
-
150
-
151
-
152
-
153
-
154
-
155
-
156
-
157
-
158
-
159
-
160
-
161
-
162
-
163
-
164
-
165
-
166
-
167
-
168
-
169
-
170
-
171
-
172
-
173
-
174
-
175
-
176
-
177
-
178
-
179
-
180
-
181
-
182
-
183
-
184
-
185
-
186
-
187
-
188
-
189
-
190
-
191
-
192
-
193
-
194
-
195
-
196
-
197
-
198
-
199
-
200
-
201
-
202
-
203
-
204
-
205
-
206
-
207
-
208
-
209
-
210
-
211
-
212
-
213
-
214
-
215
-
216
-
217
-
218
-
219
-
220
-
221
-
222
-
223
-
224
-
225
-
226
-
227
-
228
-
229
-
230
-
231
-
232
-
233
-
234
-
235
-
236
-
237
-
238
-
239
-
240
-
241
-
242
-
243
-
244
-
245
-
246
-
247
-
248
-
249
-
250
-
251
-
252
-
253
-
254
-
255
-
256
-
257
-
258
-
259
-
260
-
261
-
262
-
263
-
264
-
265
-
266
-
267
-
268
-
269
-
270
-
271
-
272
-
273
-
274
-
275
-
276
 |
 |
40
whether such legislation will be reconsidered or enacted in the future and, if enacted, what its effect would be on the Company’ s
aggregate asbestos liabilities.
The reporting pattern for assumed reinsurance claims, including those related to asbestos and environmental claims, is much longer than
for direct claims. In many instances, it takes months or years to determine that the policyholder’ s own obligations have been met and
how the reinsurance in question may apply to such claims. The delay in reporting reinsurance claims and exposures adds to the
uncertainty of estimating the related reserves.
Given the factors described above, the Company believes the actuarial tools and other techniques it employs to estimate the ultimate cost
of claims for more traditional kinds of insurance exposure are less precise in estimating reserves for its asbestos and environmental
exposures. For this reason, the Company relies on exposure-based analysis to estimate the ultimate costs of these claims and regularly
evaluates new information in assessing its potential asbestos and environmental exposures.
A number of factors affect the variability of estimates for asbestos and environmental reserves including assumptions with respect to the
frequency of claims, the average severity of those claims settled with payment, the dismissal rate of claims with no payment and the
expense to indemnity ratio. The uncertainty with respect to the underlying reserve assumptions for asbestos and environmental adds a
greater degree of variability to these reserve estimates than reserve estimates for more traditional exposures. While this variability is
reflected in part in the size of the range of reserves developed by the Company, that range may still not be indicative of the potential
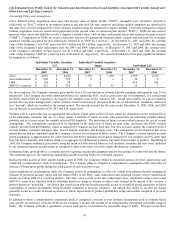
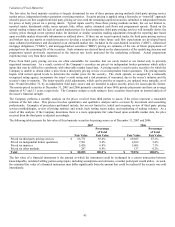
variance between the ultimate outcome and the recorded reserves. The recorded net reserves as of December 31, 2007 of $2.26 billion
($2.00 billion and $257 for asbestos and environmental, respectively) is within an estimated range, unadjusted for covariance, of $1.88
billion to $2.60 billion. The process of estimating asbestos and environmental reserves remains subject to a wide variety of
uncertainties, which are detailed in Note 12 of Notes to Consolidated Financial Statements. The Company believes that its current
asbestos and environmental reserves are reasonable and appropriate. However, analyses of further developments could cause the
Company to change its estimates and ranges of its asbestos and environmental reserves, and the effect of these changes could be
material to the Company’ s consolidated operating results, financial condition and liquidity. If there are significant developments that
affect particular exposures, reinsurance arrangements or the financial condition of particular reinsurers, the Company will make
adjustments to its reserves or to the amounts recoverable from its reinsurers.
Total Property & Casualty Reserves, Net of Reinsurance
In the opinion of management, based upon the known facts and current law, the reserves recorded for the Company’ s property and
casualty businesses at December 31, 2007 represent the Company’ s best estimate of its ultimate liability for losses and loss adjustment
expenses related to losses covered by policies written by the Company. However, because of the significant uncertainties surrounding
reserves, and particularly asbestos exposures, it is possible that management’ s estimate of the ultimate liabilities for these claims may
change and that the required adjustment to recorded reserves could exceed the currently recorded reserves by an amount that could be
material to the Company’ s results of operations, financial condition and liquidity.