SunTrust 2006 Annual Report Download - page 89
Download and view the complete annual report
Please find page 89 of the 2006 SunTrust annual report below. You can navigate through the pages in the report by either clicking on the pages listed below, or by using the keyword search tool below to find specific information within the annual report.-
 1
1 -
2
-
3
-
4
-
5
-
6
-
7
-
8
-
9
-
10
-
11
-
12
-
13
-
14
-
15
-
16
-
17
-
18
-
19
-
20
-
21
-
22
-
23
-
24
-
25
-
26
-
27
-
28
-
29
-
30
-
31
-
32
-
33
-
34
-
35
-
36
-
37
-
38
-
39
-
40
-
41
-
42
-
43
-
44
-
45
-
46
-
47
-
48
-
49
-
50
-
51
-
52
-
53
-
54
-
55
-
56
-
57
-
58
-
59
-
60
-
61
-
62
-
63
-
64
-
65
-
66
-
67
-
68
-
69
-
70
-
71
-
72
-
73
-
74
-
75
-
76
-
77
-
78
-
 79
79 -
 80
80 -
 81
81 -
 82
82 -
 83
83 -
 84
84 -
 85
85 -
 86
86 -
 87
87 -
 88
88 -
 89
89 -
 90
90 -
 91
91 -
 92
92 -
 93
93 -
 94
94 -
 95
95 -
 96
96 -
 97
97 -
 98
98 -
 99
99 -
100
-
101
-
102
-
103
-
104
-
105
-
106
-
107
-
108
-
109
-
110
-
111
-
112
-
113
-
114
-
115
-
116
-
117
-
118
-
119
-
120
-
121
-
122
-
123
-
124
-
125
-
126
-
127
-
128
-
129
-
130
-
131
-
132
-
133
-
134
-
135
-
136
-
137
-
138
-
139
-
140
-
141
-
142
-
143
-
144
-
145
-
146
-
147
-
148
-
149
-
150
-
151
-
152
-
153
-
154
-
155
-
156
-
157
-
158
-
159
 |
 |

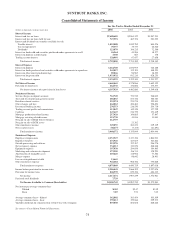
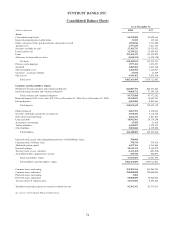
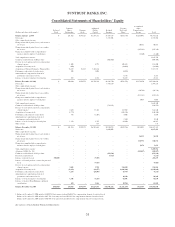
SUNTRUST BANKS, INC.
Consolidated Statements of Cash Flows
Year Ended December 31
(Dollars in thousands) 2006 2005 2004
Cash Flows from Operating Activities:
Net income $2,117,471 $1,987,239 $1,572,901
Adjustments to reconcile net income to net cash provided by (used in) operating activities:
Net gain on sale of Bond Trustee business (112,759) --
Net gain on sale of RCM assets -(23,382) -
Depreciation, amortization and accretion 810,881 783,084 667,145
Gain on sale of mortgage servicing rights (66,283) --
Origination of mortgage servicing rights (503,801) (341,694) (196,118)
Provisions for loan losses and foreclosed property 265,609 179,294 137,032
Deferred income tax provision 107,966 178,318 144,988
Amortization of compensation element of performance and restricted stock 18,340 9,190 8,515
Stock option compensation 25,969 26,375 17,443
Excess tax benefits from stock-based compensation (33,258) --
Net securities losses 50,477 7,155 41,691
Net gain on sale of assets (49,285) (4,411) (11,175)
Originated and purchased loans held for sale (47,374,700) (38,582,413) (22,618,972)
Sales and securitizations of loans held for sale 49,308,909 31,467,023 21,941,581
Net increase in other assets (470,225) (1,874,683) (616,943)
Net (decrease) increase in other liabilities (207,285) 1,470,187 91,496
Net cash provided by (used in) operating activities 3,888,026 (4,718,718) 1,179,584
Cash Flows from Investing Activities:
Proceeds from maturities, calls and repayments of securities available for sale 3,914,243 4,783,789 5,083,485
Proceeds from sales of securities available for sale 4,945,870 4,367,480 8,875,126
Purchases of securities available for sale (6,931,905) (7,221,819) (12,264,430)
Loan originations net of principal collected (9,490,800) (14,070,420) (9,555,401)
Proceeds from sale of loans 2,235,011 337,902 357,785
Proceeds from sale of mortgage servicing rights 211,157 --
Capital expenditures (334,254) (201,650) (238,009)
Proceeds from the sale of other assets 45,203 42,841 37,427
Other investing activities -5,311 2,584
Net cash used for acquisitions -- (1,265,650)
Net cash used in investing activities (5,405,475) (11,956,566) (8,967,083)
Cash Flows from Financing Activities:
Net increase in consumer and commercial deposits 2,214,246 5,470,301 5,254,911
Net (decrease) increase in foreign and brokered deposits (235,055) 13,229,240 1,135,626
Net increase (decrease) in funds purchased and other short-term borrowings 1,568,496 906,777 (1,439,497)
Proceeds from the issuance of long-term debt 2,925,024 1,974,987 4,728,616
Repayment of long-term debt (4,702,283) (3,233,688) (1,203,676)
Proceeds from the issuance of preferred stock 492,295 --
Proceeds from the exercise of stock options 215,947 135,701 96,457
Acquisition of treasury stock (1,105,043) (196,396) (14,064)
Excess tax benefits from stock-based compensation 33,258 --
Common and preferred dividends paid (887,297) (794,971) (603,309)
Net cash provided by financing activities 519,588 17,491,951 7,955,064
Net (decrease) increase in cash and cash equivalents (997,861) 816,667 167,565
Cash and cash equivalents at beginning of period 6,305,606 5,488,939 5,321,374
Cash and cash equivalents at end of period $5,307,745 $6,305,606 $5,488,939
Supplemental Disclosures:
Interest paid $5,088,403 $3,027,834 $1,472,807
Income taxes paid 709,168 684,042 575,537
Income taxes refunded (14,762) (17,593) (809)
Non-cash impact of the deconsolidation of Three Pillars -- (2,563,031)
Non-cash impact of acquisition of National Commerce Financial Corporation -- 5,517,551
See notes to Consolidated Financial Statements.
76