SunTrust 2006 Annual Report Download - page 47
Download and view the complete annual report
Please find page 47 of the 2006 SunTrust annual report below. You can navigate through the pages in the report by either clicking on the pages listed below, or by using the keyword search tool below to find specific information within the annual report.-
 1
1 -
2
-
3
-
4
-
5
-
6
-
7
-
8
-
9
-
10
-
11
-
12
-
13
-
14
-
15
-
16
-
17
-
18
-
19
-
20
-
21
-
22
-
23
-
24
-
25
-
26
-
27
-
28
-
29
-
30
-
31
-
32
-
33
-
34
-
35
-
36
-
 37
37 -
 38
38 -
 39
39 -
 40
40 -
 41
41 -
 42
42 -
 43
43 -
 44
44 -
 45
45 -
 46
46 -
 47
47 -
 48
48 -
 49
49 -
 50
50 -
 51
51 -
 52
52 -
 53
53 -
 54
54 -
 55
55 -
 56
56 -
 57
57 -
58
-
59
-
60
-
61
-
62
-
63
-
64
-
65
-
66
-
67
-
68
-
69
-
70
-
71
-
72
-
73
-
74
-
75
-
76
-
77
-
78
-
79
-
80
-
81
-
82
-
83
-
84
-
85
-
86
-
87
-
88
-
89
-
90
-
91
-
92
-
93
-
94
-
95
-
96
-
97
-
98
-
99
-
100
-
101
-
102
-
103
-
104
-
105
-
106
-
107
-
108
-
109
-
110
-
111
-
112
-
113
-
114
-
115
-
116
-
117
-
118
-
119
-
120
-
121
-
122
-
123
-
124
-
125
-
126
-
127
-
128
-
129
-
130
-
131
-
132
-
133
-
134
-
135
-
136
-
137
-
138
-
139
-
140
-
141
-
142
-
143
-
144
-
145
-
146
-
147
-
148
-
149
-
150
-
151
-
152
-
153
-
154
-
155
-
156
-
157
-
158
-
159
 |
 |

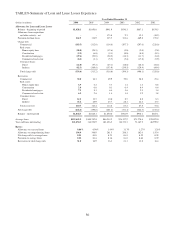
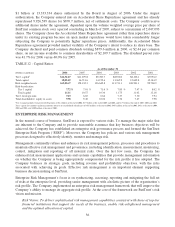
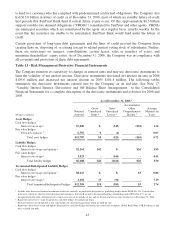
Deposits
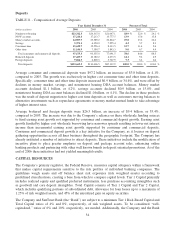
TABLE 11 - Composition of Average Deposits
Year Ended December 31 Percent of Total
(Dollars in millions) 2006 2005 2004 2006 2005 2004
Noninterest-bearing $23,312.3 $24,315.0 $21,047.1 18.9 % 22.0 % 24.2 %
NOW accounts 17,214.4 17,213.7 13,777.5 13.9 15.6 15.8
Money market accounts 24,507.9 25,589.2 22,864.7 19.8 23.2 26.2
Savings 5,371.1 6,320.0 7,225.4 4.3 5.7 8.3
Consumer time 15,622.7 12,526.4 8,333.5 12.7 11.4 9.6
Other time 11,146.9 7,390.7 3,843.3 9.0 6.7 4.4
Total consumer and commercial deposits 97,175.3 93,355.0 77,091.5 78.6 84.6 88.5
Brokered deposits 17,425.7 10,182.2 4,273.5 14.1 9.2 4.9
Foreign deposits 9,064.5 6,869.3 5,767.9 7.3 6.2 6.6
Total deposits $123,665.5 $110,406.5 $87,132.9 100.0 % 100.0 % 100.0 %
Average consumer and commercial deposits were $97.2 billion, an increase of $3.8 billion, or 4.1%,
compared to 2005. The growth was exclusively in higher cost consumer time and other time deposits.
Specifically, consumer time and other time deposits increased $6.9 billion, or 34.4%, and were offset by
declines in money market, savings, and noninterest bearing DDA account balances. Money market
accounts declined $1.1 billion, or 4.2%, savings accounts declined $0.9 billion, or 15.0%, and
noninterest bearing DDA account balances declined $1.0 billion, or 4.1%. The decline in these products
was the result of deposit migration to higher cost time deposits as well as customers moving balances to
alternative investments such as repurchase agreements or money market mutual funds to take advantage
of higher interest rates.
Average brokered and foreign deposits were $26.5 billion, an increase of $9.4 billion, or 55.4%,
compared to 2005. The increase was due to the Company’s reliance on these wholesale funding sources
to fund earning asset growth not supported by consumer and commercial deposit growth. Earning asset
growth funded by higher cost wholesale borrowing have narrower spreads resulting in lower net interest
income than incremental earning asset growth supported by consumer and commercial deposits.
Consumer and commercial deposit growth is a key initiative for the Company, as it focuses on deposit
gathering opportunities across all lines business throughout the geographic footprint. The Company has
already instituted a number of initiatives to attract deposits. These initiatives include the modification of
incentive plans to place greater emphasis on deposit and package account sales, enhancing online
banking products and partnering with other well known brands in deposit oriented promotions. As of the
end of 2006 these initiatives had not yielded meaningful results.
CAPITAL RESOURCES
The Company’s primary regulator, the Federal Reserve, measures capital adequacy within a framework
that makes capital requirements sensitive to the risk profiles of individual banking companies. The
guidelines weigh assets and off balance sheet risk exposures (risk weighted assets) according to
predefined classifications, creating a base from which to compare capital levels. Tier 1 Capital primarily
includes realized equity and qualified preferred instruments, less purchase accounting intangibles such
as goodwill and core deposit intangibles. Total Capital consists of Tier 1 Capital and Tier 2 Capital,
which includes qualifying portions of subordinated debt, allowance for loan losses up to a maximum of
1.25% of risk weighted assets, and 45% of the unrealized gain on equity securities.
The Company and SunTrust Bank (the “Bank”) are subject to a minimum Tier 1 Risk-Based Capital and
Total Capital ratios of 4% and 8%, respectively, of risk weighted assets. To be considered “well-
capitalized,” ratios of 6% and 10%, respectively, are needed. Additionally, the Company and the Bank
34