SunTrust 2006 Annual Report Download - page 120
Download and view the complete annual report
Please find page 120 of the 2006 SunTrust annual report below. You can navigate through the pages in the report by either clicking on the pages listed below, or by using the keyword search tool below to find specific information within the annual report.-
 1
1 -
2
-
3
-
4
-
5
-
6
-
7
-
8
-
9
-
10
-
11
-
12
-
13
-
14
-
15
-
16
-
17
-
18
-
19
-
20
-
21
-
22
-
23
-
24
-
25
-
26
-
27
-
28
-
29
-
30
-
31
-
32
-
33
-
34
-
35
-
36
-
37
-
38
-
39
-
40
-
41
-
42
-
43
-
44
-
45
-
46
-
47
-
48
-
49
-
50
-
51
-
52
-
53
-
54
-
55
-
56
-
57
-
58
-
59
-
60
-
61
-
62
-
63
-
64
-
65
-
66
-
67
-
68
-
69
-
70
-
71
-
72
-
73
-
74
-
75
-
76
-
77
-
78
-
79
-
80
-
81
-
82
-
83
-
84
-
85
-
86
-
87
-
88
-
89
-
90
-
91
-
92
-
93
-
94
-
95
-
96
-
97
-
98
-
99
-
100
-
101
-
102
-
103
-
104
-
105
-
106
-
107
-
108
-
109
-
 110
110 -
 111
111 -
 112
112 -
 113
113 -
 114
114 -
 115
115 -
 116
116 -
 117
117 -
 118
118 -
 119
119 -
 120
120 -
 121
121 -
 122
122 -
 123
123 -
 124
124 -
 125
125 -
 126
126 -
 127
127 -
 128
128 -
 129
129 -
 130
130 -
131
-
132
-
133
-
134
-
135
-
136
-
137
-
138
-
139
-
140
-
141
-
142
-
143
-
144
-
145
-
146
-
147
-
148
-
149
-
150
-
151
-
152
-
153
-
154
-
155
-
156
-
157
-
158
-
159
 |
 |

SUNTRUST BANKS, INC.
Notes to Consolidated Financial Statements (Continued)
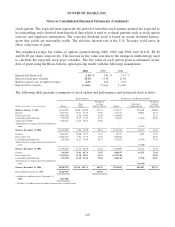
stock options. The expected term represents the period of time that stock options granted are expected to
be outstanding and is derived from historical data which is used to evaluate patterns such as stock option
exercise and employee termination. The expected dividend yield is based on recent dividend history,
given that yields are reasonably stable. The risk-free interest rate is the U.S. Treasury yield curve in
effect at the time of grant.
The weighted average fair values of options granted during 2006, 2005 and 2004 were $16.41, $8.10
and $8.40 per share, respectively. The increase in fair value was due to the change in methodology used
to calculate the expected stock price volatility. The fair value of each option grant is estimated on the
date of grant using the Black-Scholes option pricing model with the following assumptions:
2006 2005 2004
Expected dividend yield 3.18 % 2.81 % 2.54 %
Expected stock price volatility 25.64 11.98 12.98
Risk-free interest rate (weighted average) 4.51 3.62 3.10
Expected life of options 6 years 5 years 5 years
The following table presents a summary of stock option and performance and restricted stock activity:
Stock Options Performance and Restricted Stock
(Dollars in thousands except per share data) Shares
Price
Range
Weighted-
Average
Exercise Price Shares
Deferred
Compensation
Weighted-
Average
Grant Price
Balance, January 1, 2004 14,164,063 $6.96 - $76.50 $57.14 2,763,165 $29,640 $30.60
Granted 4,013,523 65.33 - 73.19 73.07 271,844 19,062 70.13
Exercised/vested (2,046,298) 6.96 - 73.06 45.89 (148,026) - 32.22
Cancelled/expired/forfeited (529,229) 45.23 - 73.19 64.79 (72,667) (3,676) 50.62
Acquisition of NCF 5,830,146 12.85 - 67.64 46.89 - - -
Amortization of compensation for performance
stock - - - - (8,515) -
Balance, December 31, 2004 21,432,205 6.96 - 76.50 58.21 2,814,316 36,511 33.82
Granted 4,064,417 70.60 - 74.25 73.12 79,353 5,685 71.91
Exercised/vested (3,046,871) 6.96 - 73.19 45.86 (449,045) - 30.28
Cancelled/expired/forfeited (659,296) 12.85 - 73.40 66.75 (117,655) (6,784) 57.92
Amortization of compensation for performance
stock - - - - (9,190) -
Balance, December 31, 2005 21,790,455 14.18 - 76.50 62.46 2,326,969 26,222 34.58
Granted 956,106 71.03 - 83.74 71.17 860,959 62,355 72.42
Exercised/vested (3,594,131) 14.18 - 74.89 53.63 (1,157,148) - 22.68
Cancelled/expired/forfeited (471,720) 14.18 - 73.40 70.81 (160,176) (9,750) 60.87
Amortization of compensation for performance
stock - - - - (18,340) -
Balance, December 31, 2006 18,680,710 $14.56 - $83.74 $64.39 1,870,604 $60,487 $57.12
Exercisable, December 31, 2006 11,487,758 $59.09
Available for additional grant, December 31,
2006 19,657,788
1Includes 1.8 million shares available to be issued as restricted stock.
107