SunTrust 2006 Annual Report Download - page 87
Download and view the complete annual report
Please find page 87 of the 2006 SunTrust annual report below. You can navigate through the pages in the report by either clicking on the pages listed below, or by using the keyword search tool below to find specific information within the annual report.-
 1
1 -
2
-
3
-
4
-
5
-
6
-
7
-
8
-
9
-
10
-
11
-
12
-
13
-
14
-
15
-
16
-
17
-
18
-
19
-
20
-
21
-
22
-
23
-
24
-
25
-
26
-
27
-
28
-
29
-
30
-
31
-
32
-
33
-
34
-
35
-
36
-
37
-
38
-
39
-
40
-
41
-
42
-
43
-
44
-
45
-
46
-
47
-
48
-
49
-
50
-
51
-
52
-
53
-
54
-
55
-
56
-
57
-
58
-
59
-
60
-
61
-
62
-
63
-
64
-
65
-
66
-
67
-
68
-
69
-
70
-
71
-
72
-
73
-
74
-
75
-
76
-
 77
77 -
 78
78 -
 79
79 -
 80
80 -
 81
81 -
 82
82 -
 83
83 -
 84
84 -
 85
85 -
 86
86 -
 87
87 -
 88
88 -
 89
89 -
 90
90 -
 91
91 -
 92
92 -
 93
93 -
 94
94 -
 95
95 -
 96
96 -
 97
97 -
98
-
99
-
100
-
101
-
102
-
103
-
104
-
105
-
106
-
107
-
108
-
109
-
110
-
111
-
112
-
113
-
114
-
115
-
116
-
117
-
118
-
119
-
120
-
121
-
122
-
123
-
124
-
125
-
126
-
127
-
128
-
129
-
130
-
131
-
132
-
133
-
134
-
135
-
136
-
137
-
138
-
139
-
140
-
141
-
142
-
143
-
144
-
145
-
146
-
147
-
148
-
149
-
150
-
151
-
152
-
153
-
154
-
155
-
156
-
157
-
158
-
159
 |
 |

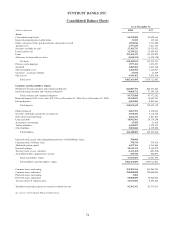
SUNTRUST BANKS, INC.
Consolidated Balance Sheets
As of December 31
(Dollars in thousands) 2006 2005
Assets
Cash and due from banks $4,235,889 $4,659,664
Interest-bearing deposits in other banks 21,810 332,444
Funds sold and securities purchased under agreements to resell 1,050,046 1,313,498
Trading assets 2,777,629 2,811,225
Securities available for sale125,101,715 26,525,821
Loans held for sale 11,790,122 13,695,613
Loans 121,454,333 114,554,895
Allowance for loan and lease losses (1,044,521) (1,028,128)
Net loans 120,409,812 113,526,767
Premises and equipment 1,977,412 1,854,527
Goodwill 6,889,860 6,835,168
Other intangible assets 1,181,984 1,122,967
Customers’ acceptance liability 15,878 11,839
Other assets 6,709,452 7,023,308
Total assets $182,161,609 $179,712,841
Liabilities and Shareholders’ Equity
Noninterest-bearing consumer and commercial deposits $22,887,176 $26,327,663
Interest-bearing consumer and commercial deposits 76,888,712 71,244,719
Total consumer and commercial deposits 99,775,888 97,572,382
Brokered deposits (CDs at fair value: $97,370 as of December 31, 2006; $0 as of December 31, 2005) 18,150,059 15,644,932
Foreign deposits 6,095,682 8,835,864
Total deposits 124,021,629 122,053,178
Funds purchased 4,867,591 4,258,013
Securities sold under agreements to repurchase 6,950,426 6,116,520
Other short-term borrowings 2,062,636 1,937,624
Long-term debt 18,992,905 20,779,249
Acceptances outstanding 15,878 11,839
Trading liabilities 1,634,097 1,529,325
Other liabilities 5,802,841 6,139,698
Total liabilities 164,348,003 162,825,446
Preferred stock, no par value (liquidation preference of $100,000 per share) 500,000 -
Common stock, $1.00 par value 370,578 370,578
Additional paid in capital 6,627,196 6,761,684
Retained earnings 10,541,152 9,310,978
Treasury stock, at cost, and other (1,151,269) (493,936)
Accumulated other comprehensive income 925,949 938,091
Total shareholders’ equity 17,813,606 16,887,395
Total liabilities and shareholders’ equity $182,161,609 $179,712,841
Common shares outstanding 354,902,566 361,984,193
Common shares authorized 750,000,000 750,000,000
Preferred shares outstanding 5,000 -
Preferred shares authorized 50,000,000 50,000,000
Treasury shares of common stock 15,675,832 8,594,205
1Includes net unrealized gains on securities available for sale $2,103,362 $1,572,033
See notes to Consolidated Financial Statements.
74