SunTrust 2006 Annual Report Download - page 54
Download and view the complete annual report
Please find page 54 of the 2006 SunTrust annual report below. You can navigate through the pages in the report by either clicking on the pages listed below, or by using the keyword search tool below to find specific information within the annual report.-
 1
1 -
2
-
3
-
4
-
5
-
6
-
7
-
8
-
9
-
10
-
11
-
12
-
13
-
14
-
15
-
16
-
17
-
18
-
19
-
20
-
21
-
22
-
23
-
24
-
25
-
26
-
27
-
28
-
29
-
30
-
31
-
32
-
33
-
34
-
35
-
36
-
37
-
38
-
39
-
40
-
41
-
42
-
43
-
 44
44 -
 45
45 -
 46
46 -
 47
47 -
 48
48 -
 49
49 -
 50
50 -
 51
51 -
 52
52 -
 53
53 -
 54
54 -
 55
55 -
 56
56 -
 57
57 -
 58
58 -
 59
59 -
 60
60 -
 61
61 -
 62
62 -
 63
63 -
 64
64 -
65
-
66
-
67
-
68
-
69
-
70
-
71
-
72
-
73
-
74
-
75
-
76
-
77
-
78
-
79
-
80
-
81
-
82
-
83
-
84
-
85
-
86
-
87
-
88
-
89
-
90
-
91
-
92
-
93
-
94
-
95
-
96
-
97
-
98
-
99
-
100
-
101
-
102
-
103
-
104
-
105
-
106
-
107
-
108
-
109
-
110
-
111
-
112
-
113
-
114
-
115
-
116
-
117
-
118
-
119
-
120
-
121
-
122
-
123
-
124
-
125
-
126
-
127
-
128
-
129
-
130
-
131
-
132
-
133
-
134
-
135
-
136
-
137
-
138
-
139
-
140
-
141
-
142
-
143
-
144
-
145
-
146
-
147
-
148
-
149
-
150
-
151
-
152
-
153
-
154
-
155
-
156
-
157
-
158
-
159
 |
 |

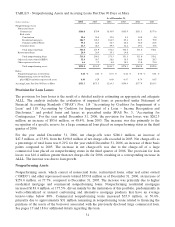
Trading Activities
Most of the Company’s trading activities are designed to support secondary trading with customers.
Product offerings to customers include debt securities, including loans traded in the secondary market,
equity securities, derivatives and foreign exchange contracts, and similar financial instruments. Other
trading activities include participating in underwritings, and acting as a market maker in certain equity
securities. Typically, the Company maintains a securities inventory to facilitate customer transactions.
However, in certain businesses, such as derivatives, it is more common to execute customer transactions
with simultaneous risk-managing transactions with dealers. Also in the normal course of business, the
Company assumes a degree of market risk in arbitrage, hedging, and other strategies, subject to
specified limits.
The Company has developed policies and procedures to manage market risk associated with trading,
capital markets and foreign exchange activities using a value-at-risk (“VaR”) approach that combines
interest rate risk, equity risk, foreign exchange risk, spread risk and volatility risk. For trading portfolios,
VaR measures the maximum fair value the Company could lose on a trading position, given a specified
confidence level and time horizon. VaR limits and exposures are monitored daily for each significant
trading portfolio. The Company’s VaR calculation measures the potential losses in fair value using a
99% confidence level. This equates to 2.33 standard deviations from the mean under a normal
distribution. This means that, on average, daily profits and losses are expected to exceed VaR one out of
every 100 overnight trading days. The VaR methodology includes holding periods for each position
based upon an assessment of relative trading market liquidity. For the foreign exchange, equities,
structured trades and derivatives desks, the Company estimates VaR by applying the Monte Carlo
simulation platform as designed by RiskMetrics™, and for the estimate of the fixed income VaR, the
Company uses Bloomberg™analytics. For equity derivatives, the Imagine system is used for VaR. The
Company uses an internally developed methodology to estimate VaR for the collateralized debt
obligations and loan trading desks.
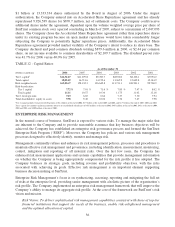
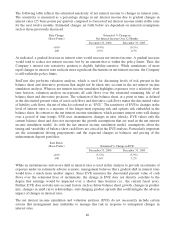
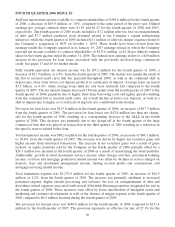
The estimated average combined Undiversified VaR (Undiversified VaR represents a simple summation
of the VaR calculated across each Desk) was $4.8 million for 2006 and $4.1 million for 2005. Trading
assets net of trading liabilities averaged $1.5 billion for 2006 and $1.4 billion for 2005. The estimated
combined period-end Undiversified VaR was $3.5 million at December 31, 2006 and $4.4 million at
December 31, 2005. Trading assets net of trading liabilities were $1.1 billion at December 31, 2006 and
$1.3 billion at December 31, 2005.
Liquidity Risk
Liquidity risk is the risk of being unable to meet obligations as they come due at a reasonable funding
cost. SunTrust manages this risk by structuring its balance sheet prudently and by maintaining
borrowing resources to fund potential cash needs. The Company assesses liquidity needs in the form of
increases in assets, maturing obligations, or deposit withdrawals, considering both operations in the
normal course of business and in times of unusual events. In addition, the Company considers the
off-balance sheet arrangements and commitments it has entered into, which could also affect the
Company’s liquidity position. The ALCO of the Company measures this risk, sets policies, and reviews
adherence to those policies.
The Company’s sources of funds include a large, stable deposit base, secured advances from the Federal
Home Loan Bank (“FHLB”) and access to the capital markets. The Company structures its balance sheet
so that illiquid assets, such as loans, are funded through customer deposits, long-term debt, other
liabilities and capital. Customer based core deposits, the Company’s largest and most cost-effective
source of funding, accounted for 62.6% of the funding base on average for 2006 compared to 64.3% for
41